What History Tells Us to Expect in 2024
2024 already feels like a unique year to be an investor.
There are two ongoing wars with simmering geopolitical tensions, which threaten deeper U.S. involvement. The Federal Reserve appears poised to cut interest rates in 2024, but the timeline is far from certain. And perhaps most obviously, there are critical elections happening across the developed world, the most consequential of which is the U.S. presidential election.1
In thinking through all of these various factors affecting the global economy and markets, it is often useful for investors to look back on history. The past doesn’t predict the future, of course. But history can serve to remind investors of what the economy and markets are capable of overcoming, and it can help us identify patterns useful for assigning probabilities.
Let’s start with geopolitics. The breakout of new crises and regional conflicts tends to hurt sentiment, create short-term uncertainty, and drive volatility. But in my view, we’re likely past the uncertainty phase with the Israel-Hamas war and the Russia-Ukraine war—markets have had plenty of time to price in each war’s likely effect on global economic output.
Insights to Help Build a Resilient Investment Portfolio in 2024
Looking for ideas on how to confidently navigate 2024’s various uncertainties? I recommend reading our free, just-released February 2024 Stock Market Outlook Report2. This report contains key insights and Zacks forecasts, such as:
• Zacks Rank S&P 500 sector picks
• Current asset allocation guidelines
• Zacks forecasts for the months ahead
• Zacks Rank industry tables
• Buy-side and sell-side consensus at a glance
• And much more!
If you have $500,000 or more to invest and want deep and detailed insights on navigating today’s markets, click on the link below to get your free report today!
IT’S FREE. Download the Just-Released February 2024 Stock Market Outlook2
To be fair, very recent escalations could easily change this calculus if U.S.-led retaliatory strikes on Iran-backed militias expand into something much bigger. This will be something to watch closely in the weeks ahead.
But we also know that looking back at conflicts since 1925 (when reliable S&P 500 data became available) such as the Korean War, Vietnam, the Cuban Missile Crisis, the Iran/Iraq War, and two U.S. wars in Iraq, it was only World War II and the Russia-Ukraine war that coincided with a bear market. I would argue that World War II was the root cause of that bear market, while inflation and the shock of aggressive monetary policy were the root causes of 2022’s bear market—not necessarily Russia’s invasion.
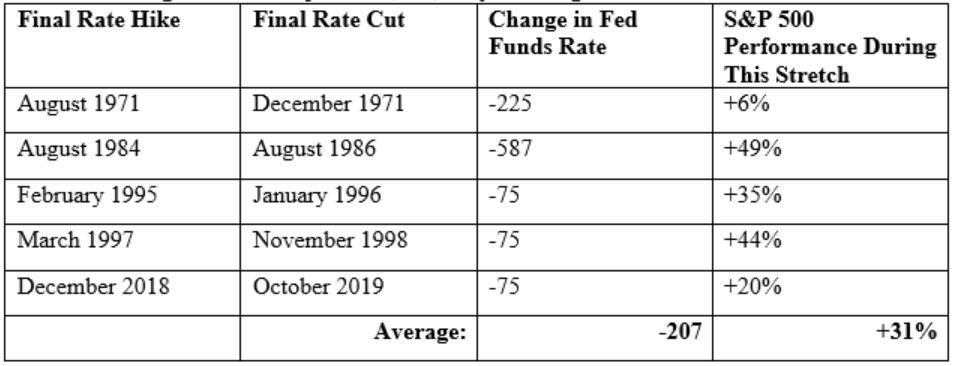
In terms of Fed policy, I think there’s too much emphasis being placed on predictions about rate cuts in 2024. Investors are too focused on when and how many times the Fed will cut rates in the new year, grossly underappreciating the most important takeaway of all: that the Fed is poised to cut rates during an economic expansion. Historically, that’s quite rare.
In the past 50+ years, there have only been five instances when the Fed engaged in rate cuts during an economic expansion. As seen in the table below, in three of these instances, the Fed cut rates by 75 basis points, which aligns with current projections moving the benchmark fed funds rate from 5% – 5.25% down to 4.25% – 4.5%. In every cycle when the Fed cut rates during an economic expansion, the S&P 500 delivered positive returns—and often very strong returns.
Rate Cuts During Economic Expansions, i.e., “Soft Landings”
Finally, there’s the election year. The primary contests are ongoing, but if the U.S. gets a Biden-Trump rematch in the general election, it will be the first time since 1892 that the two parties’ candidates have already been president. That last time was Cleveland versus Harrison.
This is an interesting fact, sure. But in my view, it’s also a very important insight for markets. It means there’s already a reasonably good understanding of policy positions and proposals from each candidate, which could theoretically equate to fewer uncertainties about taxes, property rights, and the business environment no matter who wins. Fewer uncertainties are a good thing.
Historically, markets have followed similar patterns during election years, with volatility in the runup to the general and a ‘relief rally’ once the contest is decided. It’s worth noting, too, that in both years when Trump (2016) and Biden (2020) were elected, stocks delivered above-average returns. I think that’s a testament to the fact that stock market performance is a lot less about the candidates and a lot more about the economic and earnings backdrop.
Bottom Line for Investors
It’s only February, and it feels like there’s quite a bit of concerning information out there to process. Geopolitics is center stage, but the possibility of another contentious U.S. presidential election and uncertain timing of interest rate cuts are also likely to weigh on investor sentiment.
History tells us the economy and markets can absorb these challenges. From an economic standpoint, I think inflation data has even more room to improve in the coming months, and Zacks sees a strong year for earnings growth compared to 2023. If narratives turn more negative in 2024, which they easily can, remember to return to the question that matters most: what are the economic fundamentals telling us?
For investors ready to focus on the fundamentals, I am offering all Mitch on the Market readers exclusive access to our Just-Released February 2024 Stock Market Outlook Report3.
This report contains some of our key forecasts to consider, such as:
• Zacks Rank S&P 500 sector picks
• Current asset allocation guidelines
• Zacks forecasts for the months ahead
• Zacks Rank industry tables
• Buy-side and sell-side consensus at a glance
• And much more!
If you have $500,000 or more to invest and want to learn more about our market forecasts for 2024, click on the link below to get your free report today!
Disclosure
2 Zacks Investment Management reserves the right to amend the terms or rescind the free-Stock Market Outlook Report offer at any time and for any reason at its discretion.
3 Zacks Investment Management reserves the right to amend the terms or rescind the free-Stock Market Outlook Report offer at any time and for any reason at its discretion.
DISCLOSURE
Past performance is no guarantee of future results. Inherent in any investment is the potential for loss.
Zacks Investment Management, Inc. is a wholly-owned subsidiary of Zacks Investment Research. Zacks Investment Management is an independent Registered Investment Advisory firm and acts as an investment manager for individuals and institutions. Zacks Investment Research is a provider of earnings data and other financial data to institutions and to individuals.
This material is being provided for informational purposes only and nothing herein constitutes investment, legal, accounting or tax advice, or a recommendation to buy, sell or hold a security. Do not act or rely upon the information and advice given in this publication without seeking the services of competent and professional legal, tax, or accounting counsel. Publication and distribution of this article is not intended to create, and the information contained herein does not constitute, an attorney-client relationship. No recommendation or advice is being given as to whether any investment or strategy is suitable for a particular investor. It should not be assumed that any investments in securities, companies, sectors or markets identified and described were or will be profitable. All information is current as of the date of herein and is subject to change without notice. Any views or opinions expressed may not reflect those of the firm as a whole.
Any projections, targets, or estimates in this report are forward looking statements and are based on the firm’s research, analysis, and assumptions. Due to rapidly changing market conditions and the complexity of investment decisions, supplemental information and other sources may be required to make informed investment decisions based on your individual investment objectives and suitability specifications. All expressions of opinions are subject to change without notice. Clients should seek financial advice regarding the appropriateness of investing in any security or investment strategy discussed in this presentation.
Certain economic and market information contained herein has been obtained from published sources prepared by other parties. Zacks Investment Management does not assume any responsibility for the accuracy or completeness of such information. Further, no third party has assumed responsibility for independently verifying the information contained herein and accordingly no such persons make any representations with respect to the accuracy, completeness or reasonableness of the information provided herein. Unless otherwise indicated, market analysis and conclusions are based upon opinions or assumptions that Zacks Investment Management considers to be reasonable. Any investment inherently involves a high degree of risk, beyond any specific risks discussed herein.
The S&P 500 Index is a well-known, unmanaged index of the prices of 500 large-company common stocks, mainly blue-chip stocks, selected by Standard & Poor’s. The S&P 500 Index assumes reinvestment of dividends but does not reflect advisory fees. The volatility of the benchmark may be materially different from the individual performance obtained by a specific investor. An investor cannot invest directly in an index.
The Russell 1000 Growth Index is a well-known, unmanaged index of the prices of 1000 large-company growth common stocks selected by Russell. The Russell 1000 Growth Index assumes reinvestment of dividends but does not reflect advisory fees. An investor cannot invest directly in an index. The volatility of the benchmark may be materially different from the individual performance obtained by a specific investor.
Nasdaq Composite Index is the market capitalization-weighted index of over 3,300 common equities listed on the Nasdaq stock exchange. The types of securities in the index include American depositary receipts, common stocks, real estate investment trusts (REITs) and tracking stocks, as well as limited partnership interests. The index includes all Nasdaq-listed stocks that are not derivatives, preferred shares, funds, exchange-traded funds (ETFs) or debenture securities. An investor cannot invest directly in an index. The volatility of the benchmark may be materially different from the individual performance obtained by a specific investor.
The Dow Jones Industrial Average measures the daily stock market movements of 30 U.S. publicly-traded companies listed on the NASDAQ or the New York Stock Exchange (NYSE). The 30 publicly-owned companies are considered leaders in the United States economy. An investor cannot directly invest in an index. The volatility of the benchmark may be materially different from the individual performance obtained by a specific investor.
The Bloomberg Global Aggregate Index is a flagship measure of global investment grade debt from twenty-four local currency markets. This multi-currency benchmark includes treasury, government-related, corporate and securitized fixed-rate bonds from both developed and emerging markets issuers. An investor cannot invest directly in an index. The volatility of the benchmark may be materially different from the individual performance obtained by a specific investor.
The ICE Exchange-Listed Fixed & Adjustable Rate Preferred Securities Index is a modified market capitalization weighted index composed of preferred stock and securities that are functionally equivalent to preferred stock including, but not limited to, depositary preferred securities, perpetual subordinated debt and certain securities issued by banks and other financial institutions that are eligible for capital treatment with respect to such instruments akin to that received for issuance of straight preferred stock. An investor cannot invest directly in an index. The volatility of the benchmark may be materially different from the individual performance obtained by a specific investor.
The MSCI ACWI ex U.S. Index captures large and mid-cap representation across 22 of 23 Developed Markets (DM) countries (excluding the United States) and 24 Emerging Markets (EM) countries. The index covers approximately 85% of the global equity opportunity set outside the U.S. An investor cannot invest directly in an index. The volatility of the benchmark may be materially different from the individual performance obtained by a specific investor.
The Russell 2000 Index is a well-known, unmanaged index of the prices of 2000 small-cap company common stocks, selected by Russell. The Russell 2000 Index assumes reinvestment of dividends but does not reflect advisory fees. An investor cannot invest directly in an index. The volatility of the benchmark may be materially different from the individual performance obtained by a specific investor.
The S&P Mid Cap 400 provides investors with a benchmark for mid-sized companies. The index, which is distinct from the large-cap S&P 500, is designed to measure the performance of 400 mid-sized companies, reflecting the distinctive risk and return characteristics of this market segment.
The S&P 500 Pure Value index is a style-concentrated index designed to track the performance of stocks that exhibit the strongest value characteristics by using a style-attractiveness-weighting scheme. An investor cannot directly invest in an index. The volatility of the benchmark may be materially different from the individual performance obtained by a specific investor.