In the years following the 2008-2009 Financial Crisis, many analysts and pundits warned of rising inflation. Central banks around the world had expanded their balance sheets by the trillions, and it was believed that a seemingly endless amount of quantitative easing (QE) would surely result in inflationary pressures down the road.
But runaway inflation never arrived. In fact, barely any inflation did.
Benign inflation in the years following the Global Financial Crisis left many experts perplexed, but there’s a good reason inflation never took hold. In 2008-2009, bank balance sheets were wrecked – debt to capital ratios were too high and credit was virtually frozen. When the Federal Reserve unleashed QE and other liquidity programs, much of that liquidity simply served to recapitalize banks. In other words, all the excess liquidity – which was supposed to drive inflation higher – actually just ended up parked in bank reserves.
__________________________________________________________________________
Prepare Your Investments for Inflation, Volatility and Other Uncertainties in 2021
2020 was quite the ride and many investors are choosing a different approach for 2021. As we witness market changes, I understand how planning your future economic situation can cause lots of uncertainty. Instead of making sudden and emotional investment decisions, I recommend focusing more on the hard data and economic indicators that could impact your investments in the long-term.
To help you do this, I am offering all readers our just-released Stock Market Outlook report. This report contains some of our key forecasts to consider such as:
- Economic expectations for 2021
- 2021 capital markets expectations
- A look at Covid-19 and vaccine distribution
- What produces 2021 optimism?
- What of U.S. GDP growth?
- A look at U.S. continuing claims for unemployment and Covid job data
- Zacks Rank S&P 500 Sector Picks
- And much more
If you have $500,000 or more to invest and want to learn more about these forecasts, click on the link below to get your free report today!
IT’S FREE. Download the Just-Released February 2021 Stock Market Outlook1
__________________________________________________________________________
I would argue that all of this excess liquidity, combined with ultra-low interest rates, did lead to inflation – just not the traditional, CPI type of inflation everyone talks about. What we saw instead was asset price inflation, in the form of a surging stock market. But in order to trigger consumer and producer price inflation in the real economy, there needs to be too many dollars chasing too few goods. With excess liquidity locked up in bank balance sheets, the opposite was true in 2009 and many years thereafter.
Fast-forward to the 2020 crisis, and we have a setup where banks were already well-capitalized heading into the downturn. What’s more, the pandemic-induced recession led to a deflationary shock that hit consumers, small businesses, and generally speaking, Main Street versus Wall Street. Banks fared just fine.
In 2020, the fiscal and monetary response was many times larger than the 2008-2009 spending packages, andthe trillions of dollars in stimulus spending have essentially been direct transfers into the U.S. economy (versus just sitting on bank balance sheets). The U.S. government boosted unemployment benefits by $600/week, made direct payments to U.S. households with stimulus checks, spent trillions on business loans (PPP, Main Street Lending, and bailouts), and has now signed a new stimulus package with more liquidity on the way. These dollars are not sitting on bank balance sheets – they are out circulating in the real economy.
Evidence of liquidity in the real economy can be seen in household savings. American households are not dipping into savings—they are adding to them. Households have added around $2 trillion in savings deposits since last February, thanks largely to stimulus payments and to the savings accrued by services sector closures. These accrued savings are likely to drive a spending surge later in the year, in my view, and may surface as an inflation driver.
Total Savings Deposits Have Soared Over the Last Year

Source: Federal Reserve Bank of St. Louis2
The end result of ‘direct transfer’ of liquidity into the U.S. economy is that the M2 money supply is rising at an unprecedented 25% year-over-year rate, which is much faster than during the inflationary period of the 1970s. As you can see in the chart below, M2 money supply barely ticked higher during the Financial Crisis, for reasons described above. In the current environment, however, M2 has soared:
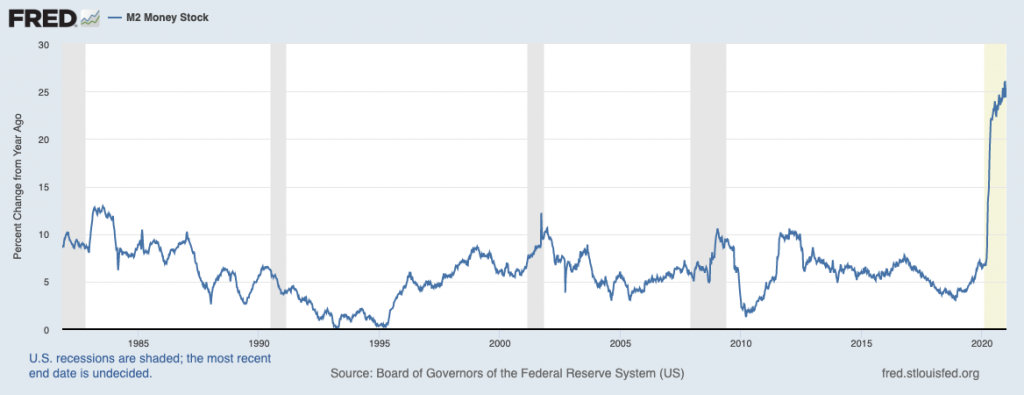
Source: Federal Reserve Bank of St. Louis3
The implication is that rising M2 money supply could give way to inflation in the not-too-distant future. I’m not sure we should be “worried” about inflation in 2021, but we should certainly be eyeing it closely. Indeed, historically, there is a fairly tight historical correlation between M2 money supply and inflation.
Bottom Line for Investors
For investors, remember that the expectation of rising inflation often puts upward pressure on interest rates, particularly longer-term rates like the 10-year U.S. Treasury. If inflation is a factor, investors want to be compensated more for locking-into a 10-year bond, thus rising interest rates. In 2021, the interplay between inflation and interest rates will be a key fundamental to track. To the extent inflation drives interest rates higher, we may reasonably expect a reality check for high valuation sectors, like Technology.
Upward pressure on inflation may also put some pressure on the Federal Reserve to tighten monetary policy, though probably not in the form of raising interest rates in 2021. Recent history with the equity market’s “taper tantrums” reminds us that dialing back accommodative monetary policy (even if just scaling back QE) can give way to volatility, which is especially prevalent in a stock market with a relatively high P/E. I expect more volatility in 2021 as a result.
Instead of trying to predict the possible highs and lows of the market, I recommend staying focused on what matters – key data points and economic indicators that could impact your investments. To help you do this, I am offering all readers our Just-Released February 2021 Stock Market Outlook Report.
This report looks at several factors that are producing optimism right now and contains some of our key forecasts to consider such as:
- Economic expectations for 2021
- 2021 capital markets expectations
- A look at Covid-19 and vaccine distribution
- What produces 2021 optimism?
- What of U.S. GDP growth?
- A look at U.S. continuing claims for unemployment and Covid job data
- Zacks Rank S&P 500 Sector Picks
- And much more
If you have $500,000 or more to invest and want to learn more about these forecasts, click on the link below to get your free report today!
Disclosure
2 Fred Economic Data. January 14, 2021. https://fred.stlouisfed.org/series/SAVINGS
3 Fred Economic Data. January 14, 2021. https://fred.stlouisfed.org/series/M2
4 Zacks Investment Management reserves the right to amend the terms or rescind the free Stock Market Outlook offer at any time and for any reason at its discretion.
DISCLOSURE
Past performance is no guarantee of future results. Inherent in any investment is the potential for loss.
Zacks Investment Management, Inc. is a wholly-owned subsidiary of Zacks Investment Research. Zacks Investment Management is an independent Registered Investment Advisory firm and acts as an investment manager for individuals and institutions. Zacks Investment Research is a provider of earnings data and other financial data to institutions and to individuals.
This material is being provided for informational purposes only and nothing herein constitutes investment, legal, accounting or tax advice, or a recommendation to buy, sell or hold a security. Do not act or rely upon the information and advice given in this publication without seeking the services of competent and professional legal, tax, or accounting counsel. Publication and distribution of this article is not intended to create, and the information contained herein does not constitute, an attorney-client relationship. No recommendation or advice is being given as to whether any investment or strategy is suitable for a particular investor. It should not be assumed that any investments in securities, companies, sectors or markets identified and described were or will be profitable. All information is current as of the date of herein and is subject to change without notice. Any views or opinions expressed may not reflect those of the firm as a whole.
Any projections, targets, or estimates in this report are forward looking statements and are based on the firm’s research, analysis, and assumptions. Due to rapidly changing market conditions and the complexity of investment decisions, supplemental information and other sources may be required to make informed investment decisions based on your individual investment objectives and suitability specifications. All expressions of opinions are subject to change without notice. Clients should seek financial advice regarding the appropriateness of investing in any security or investment strategy discussed in this presentation.
Certain economic and market information contained herein has been obtained from published sources prepared by other parties. Zacks Investment Management does not assume any responsibility for the accuracy or completeness of such information. Further, no third party has assumed responsibility for independently verifying the information contained herein and accordingly no such persons make any representations with respect to the accuracy, completeness or reasonableness of the information provided herein. Unless otherwise indicated, market analysis and conclusions are based upon opinions or assumptions that Zacks Investment Management considers to be reasonable. Any investment inherently involves a high degree of risk, beyond any specific risks discussed herein.
The S&P 500 Index is a well-known, unmanaged index of the prices of 500 large-company common stocks, mainly blue-chip stocks, selected by Standard & Poor’s. The S&P 500 Index assumes reinvestment of dividends but does not reflect advisory fees. The volatility of the benchmark may be materially different from the individual performance obtained by a specific investor. An investor cannot invest directly in an index.
The Russell 1000 Growth Index is a well-known, unmanaged index of the prices of 1000 large-company growth common stocks selected by Russell. The Russell 1000 Growth Index assumes reinvestment of dividends but does not reflect advisory fees. An investor cannot invest directly in an index. The volatility of the benchmark may be materially different from the individual performance obtained by a specific investor.
Nasdaq Composite Index is the market capitalization-weighted index of over 3,300 common equities listed on the Nasdaq stock exchange. The types of securities in the index include American depositary receipts, common stocks, real estate investment trusts (REITs) and tracking stocks, as well as limited partnership interests. The index includes all Nasdaq-listed stocks that are not derivatives, preferred shares, funds, exchange-traded funds (ETFs) or debenture securities. An investor cannot invest directly in an index. The volatility of the benchmark may be materially different from the individual performance obtained by a specific investor.
“The Dow Jones Industrial Average measures the daily stock market movements of 30 U.S. publicly-traded companies listed on the NASDAQ or the New York Stock Exchange (NYSE). The 30 publicly-owned companies are considered leaders in the United States economy. An investor cannot directly invest in an index. The volatility of the benchmark may be materially different from the individual performance obtained by a specific investor.”