Inflation has taken a big toll on the markets in 2022. Rising prices have emboldened the Federal Reserve to tighten monetary conditions at a historically fast pace, which has sapped demand for risk assets while also raising the cost of capital for individuals and businesses. It’s made for a challenging year for investors.
Inflation has also meant higher costs for materials, inventory, and labor for corporations, which erodes the value of current and future earnings. Since stock prices are based on expectations of future earnings, it makes sense that sticky inflation is highly undesirable over the long term. When considering the trade-off between the short-term pain of tightening financial conditions and the long-term positive of having inflation under control, the latter should always be preferred.
It should make sense then that seeing inflation fall from high levels has generally been beneficial for equity markets. Since 1960, the consumer price index (which measures inflation) has gone above 6% on five occasions, in 1970, 1974, 1979, 1990, and 2022. In every instance before 2022 when CPI peaked and started falling, stocks staged relatively powerful rebounds. If we see more signs in the current cycle that inflation has peaked and started falling, I would expect a similar market outcome in 2023.1
__________________________________________________________________________
Many investors are looking for signs, like inflation peaking, that the bear market may be over. To help you get more insight into if the bear market is truly ending, I am offering all readers a first look into our just-released December 2022 Stock Market Outlook report.
This report will provide you with key forecasts along with additional factors to consider:
- What fundamentals are U.S. stock markets pricing in?
- Setting U.S. return expectations for 2023
- Zacks forecasts at a glance
- What’s ‘fair value’ on the S&P500?
- And more…
If you have $500,000 or more to invest and want to learn more about these forecasts, click on the link below to get your free report today!
IT’S FREE. Download the Just-Released December 2022 Stock Market Outlook2
_________________________________________________________________________
The good news: signs of easing inflation pressure continue to appear.
One of the key areas where price pressures have all but evaporated is in supply-constrained and other goods categories. Supply chains are finally back to normal after two years of pandemic-related hitches, and the Global Supply Chain Pressure Index (chart below) was at its lowest level in October in almost two years.
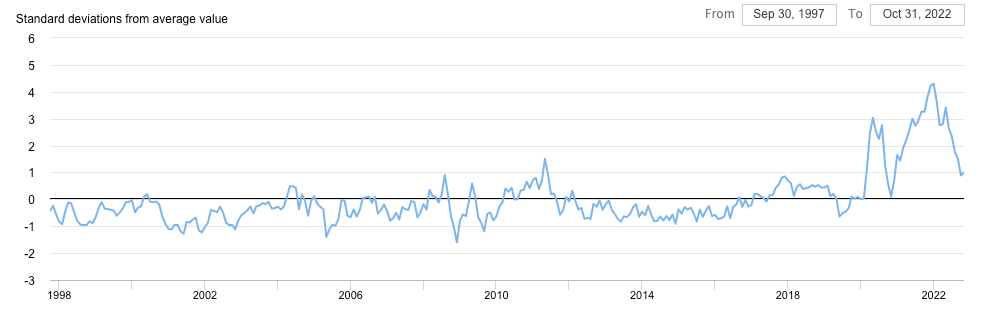
Another strong reading within the supply chain was the Institute of Supply Management’s supplier deliveries index, which measures the ability of producers to fill orders fully and on time. This index was near its best level since 2009, and 90% of surveyed panelists said that deliveries had been on pace with or faster than the previous month. Do readers remember the time when hundreds of cargo ships were stuck off the ports of Southern California? As I write, the backlog was down to six ships waiting to unload.
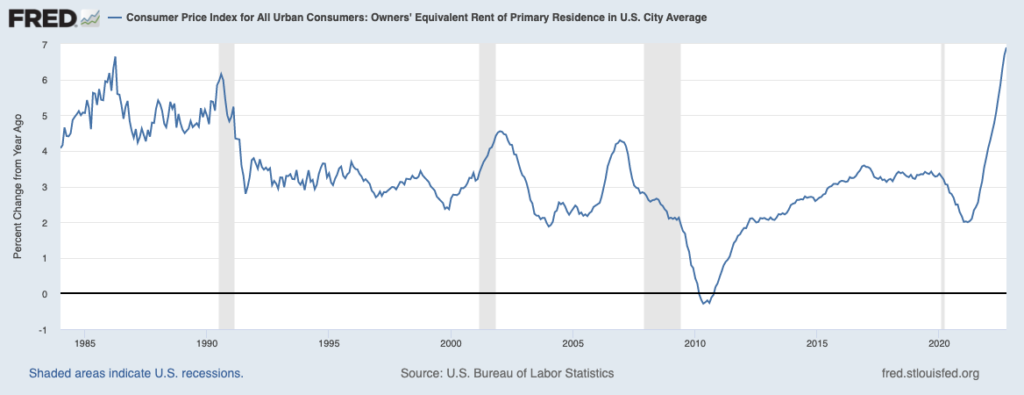
One of the big categories within the consumer price index (CPI) that has driven elevated inflation figures has been the owners’ equivalent rent component. This component makes up about 25% of the entire CPI, and it measures what an owner would pay if they rented their house, which is ultimately a reflection of strength in the housing market. It’s worth noting that the owner’s equivalent rent tends to lag home prices by about a year.
In this category, Fed policy may be having its most outsized effect, with rising mortgage rates pulling many buyers out of the market. Home sales have fallen every month since February, though prices have continued to tick higher due to very tight supply. Even still, price pressures have abated to levels last seen in the summer of 2020, and rents also decelerated to under 5% year-over-year in October.4 It’s clear from the chart below that owner’s equivalent rent continues to contribute greatly to the headline number, but it may also be very close to a peak.
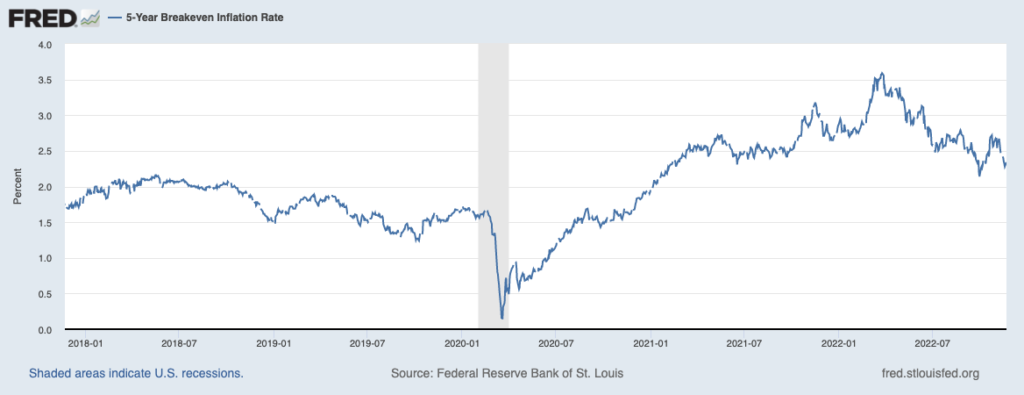
Finally, a useful leading indicator for inflation expectations is the 5-year breakeven inflation rate. This rate shows the difference between the 5-year U.S. Treasury bond yield and Treasury Inflation-Protected Securities’ (TIPS) yields. As you can see in the chart below, the spread reached a high point in late March and has been easing ever since – a sign the market thinks the worst of inflation could be behind us.
Bottom Line for Investors
Investors looking for signs that the bear market may be over would be best suited to looking for signs that inflation has peaked, in my view. Since stock ownership means having a claim to ‘real’ cash flows, it follows that companies can benefit from passing along higher costs to consumers (short term), or having inflation remain under control (long term). The latter outcome is the better one.
As the Nobel laureate Eugene Fama once pointed out, “inflation tends to be highly persistent once you get it. Once it goes down, it tends to be highly persistent on the downside.”7 I think there are signs it’s headed that way.
If you are looking for more insight into what’s next for inflation or the bear market ending, I recommend reading out Just-Released Stock Market Outlook Report.
- This report will provide you with key forecasts along with additional factors to consider What fundamentals are U.S. stock markets pricing in?
- Setting U.S. return expectations for 2023
- Zacks forecasts at a glance
- What’s ‘fair value’ on the S&P500?
- And more…
If you have $500,000 or more to invest and want to learn more about these forecasts, click on the link below to get your free report today!
Disclosure
2 Zacks Investment Management reserves the right to amend the terms or rescind the free-Stock Market Outlook Report offer at any time and for any reason at its discretion.
3 Federal Reserve Bank of New York. October 2022. https://www.newyorkfed.org/research/policy/gscpi#/interactive
4 Wall Street Journal. November 18, 2022. https://www.wsj.com/articles/u-s-home-sales-fell-for-ninth-straight-month-in-october-11668784188?mod=economy_more_pos5
5 Fred Economic Data. November 10, 2022. https://fred.stlouisfed.org/series/CUSR0000SEHC01#
6 Fred Economic Data. November 23, 2022. https://fred.stlouisfed.org/series/T5YIE#
7 The Planning Center. 2022. https://www.theplanningcenter.com/inflation-exchange-between-eugene-fama-david-booth/
8 Zacks Investment Management reserves the right to amend the terms or rescind the free-Stock Market Outlook Report offer at any time and for any reason at its discretion.
DISCLOSURE
Past performance is no guarantee of future results. Inherent in any investment is the potential for loss.
Zacks Investment Management, Inc. is a wholly-owned subsidiary of Zacks Investment Research. Zacks Investment Management is an independent Registered Investment Advisory firm and acts as an investment manager for individuals and institutions. Zacks Investment Research is a provider of earnings data and other financial data to institutions and to individuals.
This material is being provided for informational purposes only and nothing herein constitutes investment, legal, accounting or tax advice, or a recommendation to buy, sell or hold a security. Do not act or rely upon the information and advice given in this publication without seeking the services of competent and professional legal, tax, or accounting counsel. Publication and distribution of this article is not intended to create, and the information contained herein does not constitute, an attorney-client relationship. No recommendation or advice is being given as to whether any investment or strategy is suitable for a particular investor. It should not be assumed that any investments in securities, companies, sectors or markets identified and described were or will be profitable. All information is current as of the date of herein and is subject to change without notice. Any views or opinions expressed may not reflect those of the firm as a whole.
Any projections, targets, or estimates in this report are forward looking statements and are based on the firm’s research, analysis, and assumptions. Due to rapidly changing market conditions and the complexity of investment decisions, supplemental information and other sources may be required to make informed investment decisions based on your individual investment objectives and suitability specifications. All expressions of opinions are subject to change without notice. Clients should seek financial advice regarding the appropriateness of investing in any security or investment strategy discussed in this presentation.
Certain economic and market information contained herein has been obtained from published sources prepared by other parties. Zacks Investment Management does not assume any responsibility for the accuracy or completeness of such information. Further, no third party has assumed responsibility for independently verifying the information contained herein and accordingly no such persons make any representations with respect to the accuracy, completeness or reasonableness of the information provided herein. Unless otherwise indicated, market analysis and conclusions are based upon opinions or assumptions that Zacks Investment Management considers to be reasonable. Any investment inherently involves a high degree of risk, beyond any specific risks discussed herein.
The S&P 500 Index is a well-known, unmanaged index of the prices of 500 large-company common stocks, mainly blue-chip stocks, selected by Standard & Poor’s. The S&P 500 Index assumes reinvestment of dividends but does not reflect advisory fees. The volatility of the benchmark may be materially different from the individual performance obtained by a specific investor. An investor cannot invest directly in an index.
The Russell 1000 Growth Index is a well-known, unmanaged index of the prices of 1000 large-company growth common stocks selected by Russell. The Russell 1000 Growth Index assumes reinvestment of dividends but does not reflect advisory fees. An investor cannot invest directly in an index. The volatility of the benchmark may be materially different from the individual performance obtained by a specific investor.
Nasdaq Composite Index is the market capitalization-weighted index of over 3,300 common equities listed on the Nasdaq stock exchange. The types of securities in the index include American depositary receipts, common stocks, real estate investment trusts (REITs) and tracking stocks, as well as limited partnership interests. The index includes all Nasdaq-listed stocks that are not derivatives, preferred shares, funds, exchange-traded funds (ETFs) or debenture securities. An investor cannot invest directly in an index. The volatility of the benchmark may be materially different from the individual performance obtained by a specific investor.
The Dow Jones Industrial Average measures the daily stock market movements of 30 U.S. publicly-traded companies listed on the NASDAQ or the New York Stock Exchange (NYSE). The 30 publicly-owned companies are considered leaders in the United States economy. An investor cannot directly invest in an index. The volatility of the benchmark may be materially different from the individual performance obtained by a specific investor.
The Bloomberg Global Aggregate Index is a flagship measure of global investment grade debt from twenty-four local currency markets. This multi-currency benchmark includes treasury, government-related, corporate and securitized fixed-rate bonds from both developed and emerging markets issuers. An investor cannot invest directly in an index. The volatility of the benchmark may be materially different from the individual performance obtained by a specific investor.
The ICE Exchange-Listed Fixed & Adjustable Rate Preferred Securities Index is a modified market capitalization weighted index composed of preferred stock and securities that are functionally equivalent to preferred stock including, but not limited to, depositary preferred securities, perpetual subordinated debt and certain securities issued by banks and other financial institutions that are eligible for capital treatment with respect to such instruments akin to that received for issuance of straight preferred stock. An investor cannot invest directly in an index. The volatility of the benchmark may be materially different from the individual performance obtained by a specific investor.