2020 was a year beset by a public health crisis, civil unrest, political dysfunction, and uncertainty across just about every facet of life. Yet the S&P 500 still posted a stout +18.4% return for the year, following a powerful +31.5% surge in 2019.1 Never mind the fact that there was a global pandemic, more political uncertainty than usual, and a steep and scary bear market all wedged in between.
The S&P 500 Priced-In the Downturn – and the Odds of a Powerful Recovery – In Record Time

Source: Federal Reserve Bank of St. Louis2
Long-time equity investors recognize this pattern, whereby the stock market seems to defy all expectations and looks totally disconnected from reality. Some onlookers may think something is wrong, or out of whack. But history tells us this type of ‘disconnect’ happens all the time. The stock market has no emotional connection to what is happening in the moment – it is always looking ahead to what’s next, in my view. In 2021, it sees accelerating earnings, solid GDP growth, and a wall of liquidity.
__________________________________________________________________________
How Long Can the Bull Market Last in 2021?
After the rollercoaster of 2020, the beginning of 2021 has provided investors with record highs. But many investors may be wondering how much more upside is possible in 2021, and if a crash is on the horizon. Having uncertainties and fears is normal, but instead of focusing on these uncertainties, I recommend focusing more on the hard data and economic indicators that could impact your investments in the long-term.
To help you do this, I am offering all readers our just-released Stock Market Outlook report. This report contains some of our key forecasts to consider such as:
- Economic expectations for 2021
- 2021 capital markets expectations
- A look at Covid-19 and vaccine distribution
- What produces 2021 optimism?
- What of U.S. GDP growth?
- A look at U.S. continuing claims for unemployment and Covid job data
- Zacks Rank S&P 500 Sector Picks
- And much more
If you have $500,000 or more to invest and want to learn more about these forecasts, click on the link below to get your free report today!
IT’S FREE. Download the Just-Released February 2021 Stock Market Outlook3
__________________________________________________________________________
So, what will the bull market look like in 2021? I’ve been thinking about the post-World War II bull market, the “v-shaped” recovery off the financial crisis bottom of 2009, and the late-cycle risk binge we saw in 1999.
The World War II comparison is interesting. In that time, the nation was of course gripped by uncertainty, division, and broad worry about the future. The government also ran record deficits in order to finance the war, with the Fed and Treasury setting government bond yields to establish an upward sloping yield curve.
Record Debt as a Percentage of GDP: WWII and Today
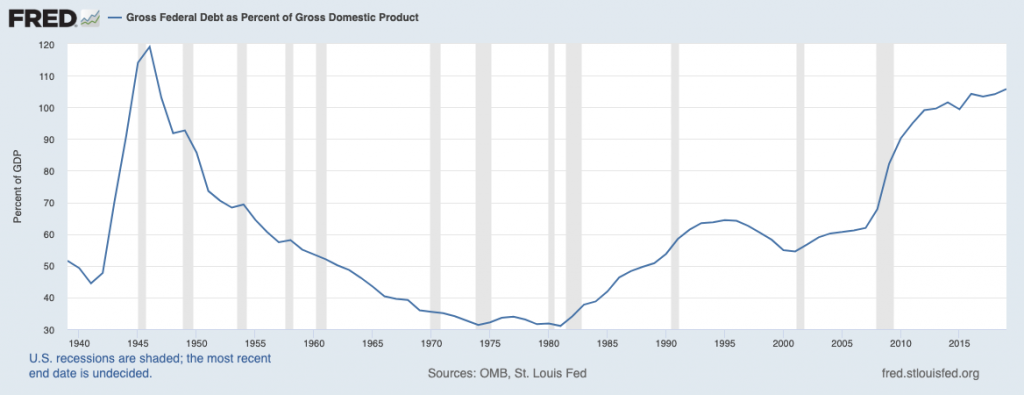
Source: Federal Reserve Bank of St. Louis4
The stock market struggled in the early months of entering the war, but after a 1942 military success in the Pacific, the “v-shaped” bounce took hold – even as the bulk of the war and all the casualties it caused were yet to occur. I see quite a few similarities to 2020, and can imagine investors being perplexed in 1942 at how the market could rise during such a devastating time.
The early-cycle recovery in 2010 also bears some resemblance to what we’ve seen late in 2020 and early 2021 – a capital rotation into small, value, and cyclical categories. Interestingly, the bounce off the bottom in 2020 favored mainly high growth, high valuation Technology and Consumer Discretionary categories, which is where I see some resemblance to 1999.
The ‘risk binge’ we saw tied to the dot com craze in 1999 pushed a lot of investors very far out onto the risk curve, paying exorbitant premiums for the possibility of supercharged future cash flows. Most of those cash flows never arrived. Technology companies are different today, in my view – the earnings growth is there. But that does not mean investors are paying fair prices. I think 2020 delivered an ultra-compressed cycle in Technology, where years of future profits were priced-into stocks in a matter of months. To the extent inflation later in the year pushes longer-term interest rates higher, I also think we could see a reality check for the Technology sector.
Bottom Line for Investors
The stock market is fully valued, trading near 23x forward earnings. The peak in 2000 saw a P/E of 26x. Many investors may wonder how much more upside is possible, just one year into the bull market.
But there is a significant difference between today and the late 1990’s: interest rates. I have written before that as long as investors expect interest rates to remain low, they will likely be more willing to pay higher premiums to own equities. In 2021, I think investors will favor equities with more attractive valuations, and will look for companies with the ability to accelerate earnings (i.e., companies with low 2020 comparisons). Finally, to the extent that inflation later in the year could push longer-term interest rates higher, I think we could see some selling pressure in high valuation categories, like Tech. More on that in a future column.
Instead of trying to guess how much upside is possible and try to time the market, I recommend staying focused on what matters – key data points and economic indicators that could impact your investments. To help you do this, I am offering all readers our Just-Released February 2021 Stock Market Outlook Report.
This report looks at several factors that are producing optimism right now and contains some of our key forecasts to consider such as:
- Economic expectations for 2021
- 2021 capital markets expectations
- A look at Covid-19 and vaccine distribution
- What produces 2021 optimism?
- What of U.S. GDP growth?
- A look at U.S. continuing claims for unemployment and Covid job data
- Zacks Rank S&P 500 Sector Picks
- And much more
If you have $500,000 or more to invest and want to learn more about these forecasts, click on the link below to get your free report today!
Disclosure
2 S&P Dow Jones Indices LLC, S&P 500 [SP500], retrieved from FRED, Federal Reserve Bank of St. Louis; https://fred.stlouisfed.org/series/SP500, January 11, 2021.
3 Zacks Investment Management reserves the right to amend the terms or rescind the free Stock Market Outlook offer at any time and for any reason at its discretion.
4 U.S. Office of Management and Budget and Federal Reserve Bank of St. Louis, Gross Federal Debt as Percent of Gross Domestic Product [GFDGDPA188S], retrieved from FRED, Federal Reserve Bank of St. Louis; https://fred.stlouisfed.org/series/GFDGDPA188S, January 11, 2021.
5 Zacks Investment Management reserves the right to amend the terms or rescind the free Stock Market Outlook offer at any time and for any reason at its discretion.
DISCLOSURE
Past performance is no guarantee of future results. Inherent in any investment is the potential for loss.
Zacks Investment Management, Inc. is a wholly-owned subsidiary of Zacks Investment Research. Zacks Investment Management is an independent Registered Investment Advisory firm and acts as an investment manager for individuals and institutions. Zacks Investment Research is a provider of earnings data and other financial data to institutions and to individuals.
This material is being provided for informational purposes only and nothing herein constitutes investment, legal, accounting or tax advice, or a recommendation to buy, sell or hold a security. Do not act or rely upon the information and advice given in this publication without seeking the services of competent and professional legal, tax, or accounting counsel. Publication and distribution of this article is not intended to create, and the information contained herein does not constitute, an attorney-client relationship. No recommendation or advice is being given as to whether any investment or strategy is suitable for a particular investor. It should not be assumed that any investments in securities, companies, sectors or markets identified and described were or will be profitable. All information is current as of the date of herein and is subject to change without notice. Any views or opinions expressed may not reflect those of the firm as a whole.
Any projections, targets, or estimates in this report are forward looking statements and are based on the firm’s research, analysis, and assumptions. Due to rapidly changing market conditions and the complexity of investment decisions, supplemental information and other sources may be required to make informed investment decisions based on your individual investment objectives and suitability specifications. All expressions of opinions are subject to change without notice. Clients should seek financial advice regarding the appropriateness of investing in any security or investment strategy discussed in this presentation.
Certain economic and market information contained herein has been obtained from published sources prepared by other parties. Zacks Investment Management does not assume any responsibility for the accuracy or completeness of such information. Further, no third party has assumed responsibility for independently verifying the information contained herein and accordingly no such persons make any representations with respect to the accuracy, completeness or reasonableness of the information provided herein. Unless otherwise indicated, market analysis and conclusions are based upon opinions or assumptions that Zacks Investment Management considers to be reasonable. Any investment inherently involves a high degree of risk, beyond any specific risks discussed herein.
The S&P 500 Index is a well-known, unmanaged index of the prices of 500 large-company common stocks, mainly blue-chip stocks, selected by Standard & Poor’s. The S&P 500 Index assumes reinvestment of dividends but does not reflect advisory fees. The volatility of the benchmark may be materially different from the individual performance obtained by a specific investor. An investor cannot invest directly in an index.
The Russell 1000 Growth Index is a well-known, unmanaged index of the prices of 1000 large-company growth common stocks selected by Russell. The Russell 1000 Growth Index assumes reinvestment of dividends but does not reflect advisory fees. An investor cannot invest directly in an index. The volatility of the benchmark may be materially different from the individual performance obtained by a specific investor.
Nasdaq Composite Index is the market capitalization-weighted index of over 3,300 common equities listed on the Nasdaq stock exchange. The types of securities in the index include American depositary receipts, common stocks, real estate investment trusts (REITs) and tracking stocks, as well as limited partnership interests. The index includes all Nasdaq-listed stocks that are not derivatives, preferred shares, funds, exchange-traded funds (ETFs) or debenture securities. An investor cannot invest directly in an index. The volatility of the benchmark may be materially different from the individual performance obtained by a specific investor.
“The Dow Jones Industrial Average measures the daily stock market movements of 30 U.S. publicly-traded companies listed on the NASDAQ or the New York Stock Exchange (NYSE). The 30 publicly-owned companies are considered leaders in the United States economy. An investor cannot directly invest in an index. The volatility of the benchmark may be materially different from the individual performance obtained by a specific investor.”