Why Equity Investors are Actively Rotating Capital
A diversified portfolio of U.S. stocks has performed well over the past few years, but the ability to generate strong alpha has largely relied on being overweight by a few key names (most of which are in the “Magnificent Seven”).1
But this has not been the case in 2026.
As I write, the S&P 500 Equal Weight Index is outperforming the market-cap weighted S&P 500 Index by approximately 200 basis points year-to-date, which sends a clear signal that investors have been rotating capital away from the hottest trade.
We know this because the traditional S&P 500 is market-cap weighted, which means the largest companies (mega-cap tech stocks) have the greatest influence on performance. The equal-weight version gives every company the same weight. When the equal-weight index outperforms, it suggests the average stock is doing better than the headline index may indicate.
Put simply, many of “the other 493 stocks” in the index are quietly experiencing solid, sometimes bigger gains. This is a healthy development, and I think the reason comes down to three forces: earnings strength, fading uncertainty, and more selectivity within the AI trade.
Let’s start with earnings.
According to our colleagues at Zacks Investment Research, aggregate earnings for the S&P 500 grew +40.9% year-over-year on +14.5% higher revenues. Positive surprises were also widespread, with 83.8% beating EPS estimates and 76.9% topping revenue estimates.
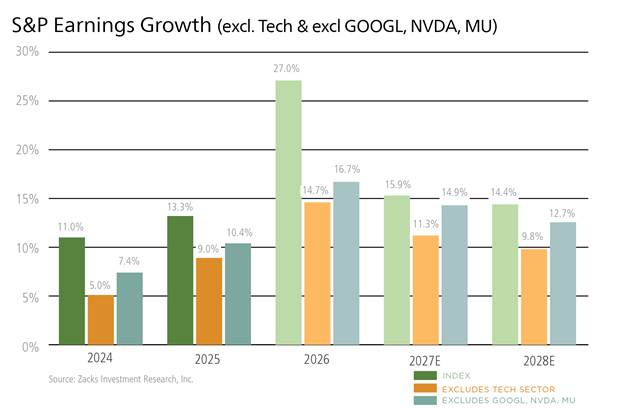
To be fair, some of the headline earnings strength is still being driven by a few very large companies. But the earnings story does not disappear when those companies are removed. As seen on the nearby chart, if we exclude Technology sector earnings and a few key earnings drivers in Q2, we still get around 15% year-over-year earnings growth—a strong improvement from previous years.
The same point shows up within the Technology sector. Zacks data shows that Q2 earnings growth in the Tech sector remains heavily concentrated in Nvidia, Micron, and Alphabet. Stripping out those three companies reduces Q2 earnings growth for the rest of the Tech sector from +95.2% to +33.7%. Quite a revision, but still very strong overall.
The second force, I think, is driving the broadening is fading uncertainty. Market leadership often narrows when uncertainty is high, as investors tend to crowd into the companies and themes with the clearest earnings visibility, strongest balance sheets, or most durable growth. Over the last few years, that has clearly been mega-cap Technology and AI-linked stocks.
But in 2026, several major risks have become easier for markets to process. The war and oil price volatility are of course still front-and-center, but investors have had six months to gauge the impact on energy prices and corporate earnings. Similarly, tariff policy has returned to headlines, but the market has moved beyond the initial shock phase and is now assessing company-by-company exposure. The Fed’s outlook on interest rates may be the remaining wild card, but I think if we’re talking about 25 basis points in either direction, it’s not enough to factor as a negative surprise.
The final force is more selectivity within the AI trade. In July, AI-linked areas like semiconductors, memory, power, liquid cooling, and optical networking all came under pressure. When a trade becomes more volatile, investors often look for ways to reduce concentration and find opportunities elsewhere. And indeed, in August, the rebound became more differentiated, with investors rewarding some parts of the AI ecosystem more than others. That type of selectivity is healthier than simply buying the entire theme indiscriminately.
It has also meant investors are increasingly looking for earnings growth in sectors that were written off earlier in the year—which is how rotation often works. Companies and sectors that were overlooked earlier in the year are getting a second look as fundamentals improve and the macro backdrop becomes easier to assess. In my view, that is an important shift. A rally led by a handful of mega-cap stocks can work for a while, but a rally supported by more companies, more sectors, and more earnings drivers tends to be a healthier market environment.
Bottom Line for Investors
The U.S. stock market has not completely moved past the concentration issue. But the rally is becoming broader, as equal-weight outperformance, strong earnings growth outside a few headline names, and more participation across sectors all suggest the market has more support beneath the surface than many investors may realize. For diversified investors, that is an encouraging signal. Diversification does not always feel valuable when leadership is narrow, but it becomes important when leadership changes—which is what we’ve seen in 2026 year-to-date.
Disclosure
2 Zacks.com. August 19, 2026. https://www.zacks.com/commentary/2977249/tech-energy-fuel-sp-500-growth-engine
DISCLOSURE
Past performance is no guarantee of future results. Inherent in any investment is the potential for loss.
Zacks Investment Management, Inc. is a wholly-owned subsidiary of Zacks Investment Research. Zacks Investment Management is an independent Registered Investment Advisory firm and acts as an investment manager for individuals and institutions. Zacks Investment Research is a provider of earnings data and other financial data to institutions and to individuals.
This material is being provided for informational purposes only and nothing herein constitutes investment, legal, accounting or tax advice, or a recommendation to buy, sell or hold a security. Do not act or rely upon the information and advice given in this publication without seeking the services of competent and professional legal, tax, or accounting counsel. Publication and distribution of this article is not intended to create, and the information contained herein does not constitute, an attorney-client relationship. No recommendation or advice is being given as to whether any investment or strategy is suitable for a particular investor. It should not be assumed that any investments in securities, companies, sectors or markets identified and described were or will be profitable. All information is current as of the date of herein and is subject to change without notice. Any views or opinions expressed may not reflect those of the firm as a whole.
Any projections, targets, or estimates in this report are forward looking statements and are based on the firm’s research, analysis, and assumptions. Due to rapidly changing market conditions and the complexity of investment decisions, supplemental information and other sources may be required to make informed investment decisions based on your individual investment objectives and suitability specifications. All expressions of opinions are subject to change without notice. Clients should seek financial advice regarding the appropriateness of investing in any security or investment strategy discussed in this presentation.
Certain economic and market information contained herein has been obtained from published sources prepared by other parties. Zacks Investment Management does not assume any responsibility for the accuracy or completeness of such information. Further, no third party has assumed responsibility for independently verifying the information contained herein and accordingly no such persons make any representations with respect to the accuracy, completeness or reasonableness of the information provided herein. Unless otherwise indicated, market analysis and conclusions are based upon opinions or assumptions that Zacks Investment Management considers to be reasonable. Any investment inherently involves a high degree of risk, beyond any specific risks discussed herein.
The S&P 500 Index is a well-known, unmanaged index of the prices of 500 large-company common stocks, mainly blue-chip stocks, selected by Standard & Poor’s. The S&P 500 Index assumes reinvestment of dividends but does not reflect advisory fees. The volatility of the benchmark may be materially different from the individual performance obtained by a specific investor. An investor cannot invest directly in an index.
The Russell 2000 Index is a well-known, unmanaged index of the prices of 2000 small-cap company common stocks, selected by Russell. The Russell 2000 Index assumes reinvestment of dividends but does not reflect advisory fees. An investor cannot invest directly in an index. The volatility of the benchmark may be materially different from the individual performance obtained by a specific investor.
The Nasdaq Composite Index measures all Nasdaq domestic and international based common type stocks listed on The Nasdaq Stock Market. To be eligible for inclusion in the Index, the security's U.S. listing must be exclusively on The Nasdaq Stock Market (unless the security was dually listed on another U.S. market prior to January 1, 2004 and has continuously maintained such listing). The security types eligible for the Index include common stocks, ordinary shares, ADRs, shares of beneficial interest or limited partnership interests and tracking stocks. Security types not included in the Index are closed-end funds, convertible debentures, exchange traded funds, preferred stocks, rights, warrants, units and other derivative securities. An investor cannot invest directly in an index.