The Market Rally May Feel ‘Hot,’ But the Data Still Supports It
Many investors are looking at the current market rally and wondering if it is sustainable. If you’re a retiree, the concern may run even deeper, as your natural focus is on preserving gains, avoiding major drawdowns, and making sure your portfolio can support long-term income needs.
To put it another way: when stocks move higher in a hurry, it is reasonable to ask whether the market has moved too far, too fast.
The only real way to answer the question is to look at the earnings and economic fundamentals, in my view. Market volatility, which I often remind readers can move stocks in both directions, is driven by sentiment in the short run, but over time, earnings, economic growth, business investment, and consumer demand matter far more. If that’s the criteria we use to evaluate the current market, the rally looks to me like it has fundamental support.
The clearest tailwind is coming from corporate earnings.
Through August 7, 444 S&P 500 companies had reported Q2 results, representing nearly 89% of the index’s membership. For those companies, earnings were up 42.2% from the same period last year on 14.8% higher revenues. That’s not a misprint—42.2% year-over-year earnings growth! The beat rates were also strong, with 82.7% of companies exceeding earnings estimates and 76.4% topping revenue expectations.
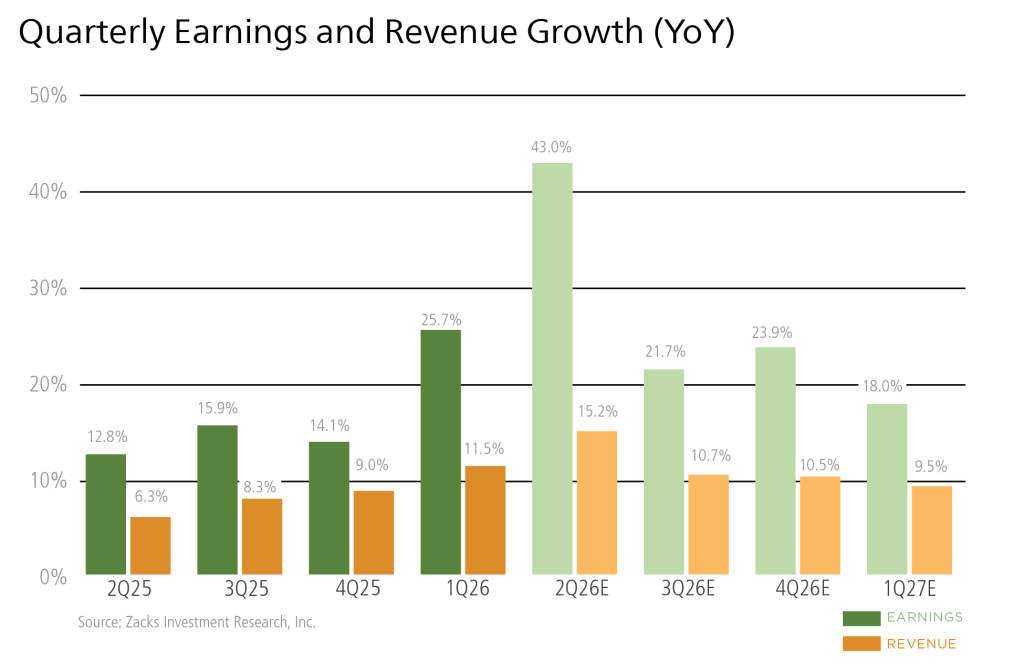
To be fair, the headline earnings growth rate is getting a major boost from a few large companies. Alphabet’s Q2 results included a sizable non-operating unrealized gain tied to its SpaceX stake, and companies like Nvidia and Micron continue to have an outsized impact on the Technology sector’s growth rate. But the broader earnings picture still looks constructive even after accounting for that concentration. According to our colleagues at Zacks Investment Research, total S&P 500 earnings are expected to rise 27.1% in 2026. Excluding the Technology sector, earnings are still expected to increase 14.6%—a solid showing that I think speaks to broad economic strength.
The U.S. GDP data tells a similar story. Headline Q2 real GDP growth slowed to 1.5% annualized from 2.1% in Q1, which may seem fairly “muddle-through” for an economic growth rate. But underneath the headline figure, private-sector components were stronger than many appreciate, and I tend to think these data matter more than government spending and imports/exports, for instance.
The private sector components—consumer spending, business investment, and residential investment—grew at a 3.3% annualized pace, the strongest reading in more than three years. Personal consumption expenditures rose 3.2% annualized after increasing just 0.5% in Q1, and durable goods spending climbed 6.8%. Business investment also remained strong, with capital spending up 8.4% annualized after a 10.6% gain in Q1. These are strong prints across the board.
It’s not all big growth and expansion, however. July payrolls fell by -23,000, missing expectations for a gain. But a meaningful part of the July decline appears to have come from local government employment, while private employers still added 30,000 jobs. That is soft, to be sure, but it is not the same as broad labor market deterioration. Monthly jobs data can also be choppy and subject to revision, so the key is whether weakness persists. It’s something to watch in the months ahead.
Bottom Line for Investors
Strong rallies can make investors nervous, especially when they happen quickly and when leadership appears concentrated in a handful of large companies. But I’d argue the current market advance has not been built on sentiment alone.
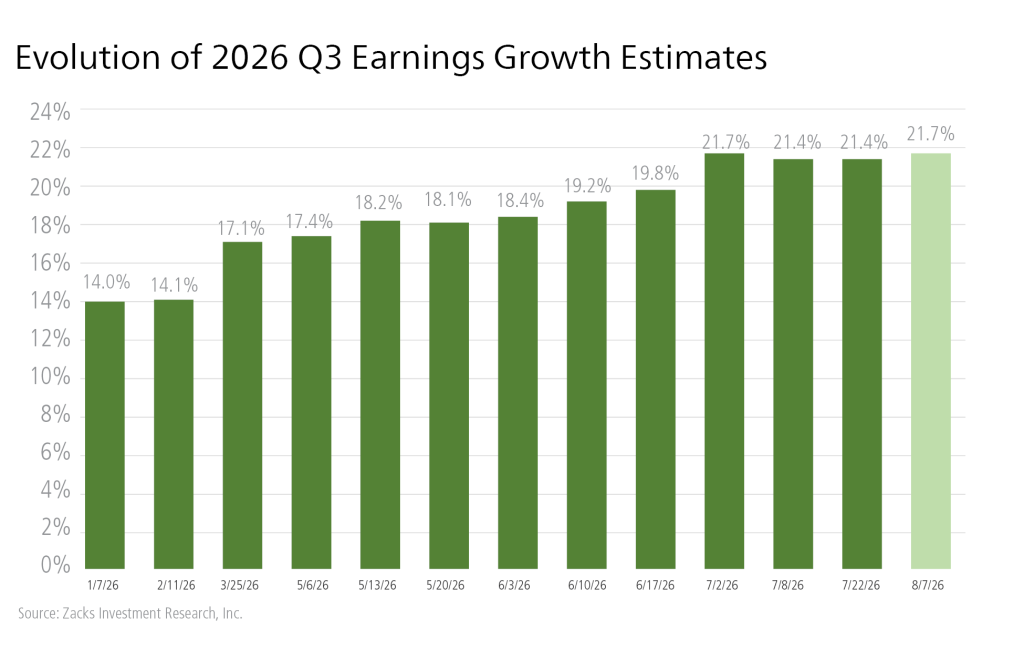
The data are giving investors a reasonable explanation for the market’s strength. Corporate earnings are growing, revenues are rising, business investment remains healthy, and the economy continues to expand. Earnings expectations continue to move higher, too, which speaks to the corporate outlook.
The AI buildout may be difficult to fully grasp, but it is showing up in real spending, real revenue, and real earnings power. And that’s what matters to stocks.
Disclosure
DISCLOSURE
Past performance is no guarantee of future results. Inherent in any investment is the potential for loss.
Zacks Investment Management, Inc. is a wholly-owned subsidiary of Zacks Investment Research. Zacks Investment Management is an independent Registered Investment Advisory firm and acts as an investment manager for individuals and institutions. Zacks Investment Research is a provider of earnings data and other financial data to institutions and to individuals.
This material is being provided for informational purposes only and nothing herein constitutes investment, legal, accounting or tax advice, or a recommendation to buy, sell or hold a security. Do not act or rely upon the information and advice given in this publication without seeking the services of competent and professional legal, tax, or accounting counsel. Publication and distribution of this article is not intended to create, and the information contained herein does not constitute, an attorney-client relationship. No recommendation or advice is being given as to whether any investment or strategy is suitable for a particular investor. It should not be assumed that any investments in securities, companies, sectors or markets identified and described were or will be profitable. All information is current as of the date of herein and is subject to change without notice. Any views or opinions expressed may not reflect those of the firm as a whole.
Any projections, targets, or estimates in this report are forward looking statements and are based on the firm’s research, analysis, and assumptions. Due to rapidly changing market conditions and the complexity of investment decisions, supplemental information and other sources may be required to make informed investment decisions based on your individual investment objectives and suitability specifications. All expressions of opinions are subject to change without notice. Clients should seek financial advice regarding the appropriateness of investing in any security or investment strategy discussed in this presentation.
Certain economic and market information contained herein has been obtained from published sources prepared by other parties. Zacks Investment Management does not assume any responsibility for the accuracy or completeness of such information. Further, no third party has assumed responsibility for independently verifying the information contained herein and accordingly no such persons make any representations with respect to the accuracy, completeness or reasonableness of the information provided herein. Unless otherwise indicated, market analysis and conclusions are based upon opinions or assumptions that Zacks Investment Management considers to be reasonable. Any investment inherently involves a high degree of risk, beyond any specific risks discussed herein.
The S&P 500 Index is a well-known, unmanaged index of the prices of 500 large-company common stocks, mainly blue-chip stocks, selected by Standard & Poor’s. The S&P 500 Index assumes reinvestment of dividends but does not reflect advisory fees. The volatility of the benchmark may be materially different from the individual performance obtained by a specific investor. An investor cannot invest directly in an index.
The Russell 2000 Index is a well-known, unmanaged index of the prices of 2000 small-cap company common stocks, selected by Russell. The Russell 2000 Index assumes reinvestment of dividends but does not reflect advisory fees. An investor cannot invest directly in an index. The volatility of the benchmark may be materially different from the individual performance obtained by a specific investor.
The Nasdaq Composite Index measures all Nasdaq domestic and international based common type stocks listed on The Nasdaq Stock Market. To be eligible for inclusion in the Index, the security's U.S. listing must be exclusively on The Nasdaq Stock Market (unless the security was dually listed on another U.S. market prior to January 1, 2004 and has continuously maintained such listing). The security types eligible for the Index include common stocks, ordinary shares, ADRs, shares of beneficial interest or limited partnership interests and tracking stocks. Security types not included in the Index are closed-end funds, convertible debentures, exchange traded funds, preferred stocks, rights, warrants, units and other derivative securities. An investor cannot invest directly in an index.