More Market Volatility May Be Coming—and That’s OK
After a strong second quarter when stocks rebounded sharply from war- and energy-driven volatility, equity and fixed income markets have settled into a more unsettled holding pattern. Selling pressure has appeared in spurts, and the day-to-day trading environment has become noticeably less comfortable.1
The Volatility Index (VIX) has ticked higher over the past several weeks, as investors seem to be pricing in more uncertainty than they were earlier this summer.2
CBOE Volatility Index: VIX
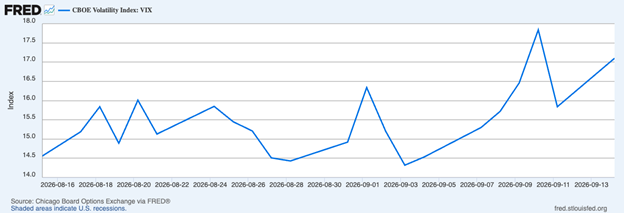
The rising volatility and selling pressure haven’t emerged out of thin air.
Oil is one obvious source of concern. U.S. crude prices have risen about 20% over the past three weeks to over $100 per barrel, while diesel has climbed to a record $6.23 per gallon and gasoline has rebounded to $4.32 (as I write). At the same time, commercial fuel inventories have been drawing down, and disruptions to Saudi Arabia’s East-West pipeline have reportedly removed another 2.5 million barrels per day of supply from an already tight global market.
We know that some of the buffers that helped absorb the initial energy shock earlier this year have diminished. But even still, $100 oil itself has never been an especially useful market threshold. Between 2008 and the start of 2026, Brent closed above $100 per barrel in over 200 weeks, and equity markets rose in forward 12-month periods over 80% of the time. In other words, the bull market and the economy withstood higher oil much of the time.
In my view, the more important risk today is persistence—whether elevated energy costs last long enough to weaken consumer spending, business activity, and corporate earnings. This risk remains on our radar, but we’re not seeing signs of it yet.
Interest rates are another source of pressure. The 10-year Treasury yield briefly touched 5% this week, after starting the year near 4.15%. That’s a substantial jump, and higher yields can of course increase borrowing costs throughout the economy and place pressure on stock valuations, particularly when rates move quickly.
But here too, the market has shown an ability to absorb the move. The S&P 500 remains up more than 10% this year despite the steady rise in yields. Strong earnings and economic growth can provide support as rates move higher, and we’ve been fortunate to see record-level earnings from Corporate America. Estimates for future quarters keep moving higher as well, which is the reason I think the 10-year at 5% didn’t trigger a major equity market move.
Finally, investors are once again adjusting expectations for Federal Reserve policy. Going into Wednesday’s policy meeting, markets were assigning a roughly 85% probability to a September rate hike, following August’s CPI print of 3.4%. With the Fed raising rates a quarter point, the market got what it expected, but the choppiness leading up to the decision may have been about resetting expectations. As I’ve written many times before, a quarter-point move by itself is unlikely to determine the market’s long-term direction, but rapid changes in Fed expectations can produce meaningful short-term swings.
Taken together, there is plenty here to give markets a reason to remain choppy, which is why I implied in the title that more volatility may be coming.
But here’s why that’s ok.
When markets rise steadily for months, normal volatility starts to feel abnormal. A 2% down day feels ominous. A 5% pullback over a few weeks can attract warnings about what could come next, and a 10% correction can suddenly feel like evidence that the entire investment thesis has changed.
But investors need to remember that volatility serves an important purpose in markets. Prices constantly adjust as investors digest new information, reassess risks, and change their expectations about future earnings. Corrections can temper excessive optimism, reset valuations, and force investors to become more discerning about what they own. In that sense, the occasional pullback is a sign that markets are functioning normally.
Bottom Line for Investors
A meaningful correction at some point would hardly surprise me—and by itself, it would not change my long-term view. Volatility is part of how markets reset expectations, reprice risk, and ultimately create healthier conditions for future gains.
For investors, the more important question is whether anything fundamental has changed in your financial goals, time horizon, or long-term investment thesis. If the answer is no, a period of market turbulence is usually a reason to stay disciplined—not a reason to abandon the plan.
Disclosure
2 Morningstar. September 14, 2026. “Why the Odds of a US Fed Interest Rate Hike Just Shot Higher.”
3 FRED Fred Economic Data. September 17, 2026. “CBOE Volatility Index: VIX (VIXCLS)”
DISCLOSURE
Past performance is no guarantee of future results. Inherent in any investment is the potential for loss.
Zacks Investment Management, Inc. is a wholly-owned subsidiary of Zacks Investment Research. Zacks Investment Management is an independent Registered Investment Advisory firm and acts as an investment manager for individuals and institutions. Zacks Investment Research is a provider of earnings data and other financial data to institutions and to individuals.
This material is being provided for informational purposes only and nothing herein constitutes investment, legal, accounting or tax advice, or a recommendation to buy, sell or hold a security. Do not act or rely upon the information and advice given in this publication without seeking the services of competent and professional legal, tax, or accounting counsel. Publication and distribution of this article is not intended to create, and the information contained herein does not constitute, an attorney-client relationship. No recommendation or advice is being given as to whether any investment or strategy is suitable for a particular investor. It should not be assumed that any investments in securities, companies, sectors or markets identified and described were or will be profitable. All information is current as of the date of herein and is subject to change without notice. Any views or opinions expressed may not reflect those of the firm as a whole.
Any projections, targets, or estimates in this report are forward looking statements and are based on the firm’s research, analysis, and assumptions. Due to rapidly changing market conditions and the complexity of investment decisions, supplemental information and other sources may be required to make informed investment decisions based on your individual investment objectives and suitability specifications. All expressions of opinions are subject to change without notice. Clients should seek financial advice regarding the appropriateness of investing in any security or investment strategy discussed in this presentation.
Certain economic and market information contained herein has been obtained from published sources prepared by other parties. Zacks Investment Management does not assume any responsibility for the accuracy or completeness of such information. Further, no third party has assumed responsibility for independently verifying the information contained herein and accordingly no such persons make any representations with respect to the accuracy, completeness or reasonableness of the information provided herein. Unless otherwise indicated, market analysis and conclusions are based upon opinions or assumptions that Zacks Investment Management considers to be reasonable. Any investment inherently involves a high degree of risk, beyond any specific risks discussed herein.
The S&P 500 Index is a well-known, unmanaged index of the prices of 500 large-company common stocks, mainly blue-chip stocks, selected by Standard & Poor’s. The S&P 500 Index assumes reinvestment of dividends but does not reflect advisory fees. The volatility of the benchmark may be materially different from the individual performance obtained by a specific investor. An investor cannot invest directly in an index.
The CBOE Volatility Index (VIX) is a calculation designed to produce a measure of constant, 30-day expected volatility of the U.S. stock market, derived from real-time, mid-quote prices of S&P 500 Index call and put options. On a global basis, it is one of the most recognized measures of volatility -- widely reported by financial media and closely followed by a variety of market participants as a daily market indicator. The volatility of the benchmark may be materially different from the individual performance obtained by a specific investor. An investor cannot invest directly in an index.