On March 9, 2009, the economic news of the day was about as terrible as it could get. The S&P 500 was down almost -60% from its 2007 peak, and the U.S. jobs report that came out just three days before—on March 6, 2009—painted a very bleak picture.1
Employers had shed 651,000 jobs in February 2009, with job losses across nearly every major industry in the U.S. February’s job losses brought the 4-month total of layoffs to 2.6 million, bringing the total number of unemployed Americans to 12.5 million. The unemployment rate rose from 7.6% to 8.1%.2
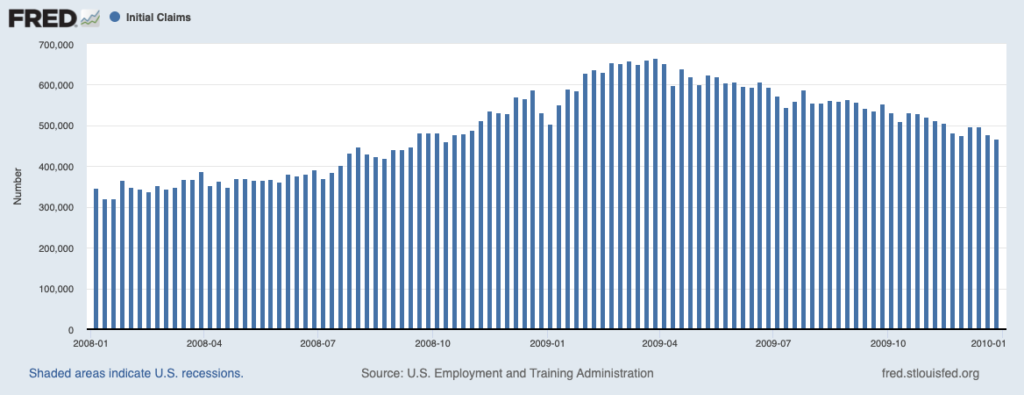
The economic picture was bad and all signs pointed to more pain, which is exactly what happened. The unemployment rate kept rising throughout 2009 and would eventually cross 10% in the fall, with well over 15 million Americans out of work. As you can see in the chart below, new jobless claims would stay elevated throughout the year. The labor-force participation rate would also fall throughout the year, as many people gave up looking for a new job. It was one of the more challenging economic times in history.
Jobless Claims in 2008 and 2009
For many people, early 2009 probably felt like an awful time to be an investor. But the opposite turned out to be true. Three days after the ugly February 2009 jobs report, with many more months of rising job losses still left to go, the bear market officially ended. In this case, as in just about every other in history, positioning for a market rebound meant being invested when everything looked and felt its worst.
There is no clear formula for what will ultimately constitute the ‘worst’ of the economic cycle or the bottom of the bear market. If we look historically at valuations, interest rates, inflation, unemployment, etc., there are no distinct levels or patterns that have indicated a bottom every time. Bond yields have been rising when a bear market ends, but they have also been falling. Valuations have sometimes fallen back to previous cycle lows, but not always. The only factor that has been consistent throughout history is that bear markets end when news is bad.
In the current environment, the bad news has been coming in the form of elevated inflation readings and rapidly rising interest rates. In the not-too-distant future, in my view, we are likely to see a precipitous drop in job openings and perhaps more layoffs, falling earnings estimates (which is already happening), and a rising likelihood of confirmation that the U.S. is in recession. This is all bad news that has not happened yet, but if/when it does, investors should see it as a contra-indicator to get positioned for the bear market to end and the new bull to begin.
Bottom Line for Investors
Being positioned for the market rebound in March 2009 meant having the opportunity to participate in the +451.3% gains over 10.8 years that U.S. stocks would deliver (S&P 500). It is rarely easy—in the early days of the new bull market, the news will be bad and market commentators will routinely call it another bear market rally. Investors should expect to see and hear this negativity in this cycle, too.
If you are having a hard time being patient amidst the negativity, just remember what’s potentially at stake in the handoff between bear and bull markets. From 1942-present, the average bear market lasted approximately 11.1 months with an average magnitude of -31.7%. Over the same time period, however, the average bull market lasted 4.4 years with an average magnitude of +155.7%. Bull markets are longer and stronger than bear markets.
Disclosure
2 Bureau of Labor Statistics. February 2009. https://www.bls.gov/news.release/archives/empsit_03062009.pdf
3 Fred Economic Data. October 20, 2022. https://fred.stlouisfed.org/series/ICSA#
DISCLOSURE
Past performance is no guarantee of future results. Inherent in any investment is the potential for loss.
Zacks Investment Management, Inc. is a wholly-owned subsidiary of Zacks Investment Research. Zacks Investment Management is an independent Registered Investment Advisory firm and acts as an investment manager for individuals and institutions. Zacks Investment Research is a provider of earnings data and other financial data to institutions and to individuals.
This material is being provided for informational purposes only and nothing herein constitutes investment, legal, accounting or tax advice, or a recommendation to buy, sell or hold a security. Do not act or rely upon the information and advice given in this publication without seeking the services of competent and professional legal, tax, or accounting counsel. Publication and distribution of this article is not intended to create, and the information contained herein does not constitute, an attorney-client relationship. No recommendation or advice is being given as to whether any investment or strategy is suitable for a particular investor. It should not be assumed that any investments in securities, companies, sectors or markets identified and described were or will be profitable. All information is current as of the date of herein and is subject to change without notice. Any views or opinions expressed may not reflect those of the firm as a whole.
Any projections, targets, or estimates in this report are forward looking statements and are based on the firm’s research, analysis, and assumptions. Due to rapidly changing market conditions and the complexity of investment decisions, supplemental information and other sources may be required to make informed investment decisions based on your individual investment objectives and suitability specifications. All expressions of opinions are subject to change without notice. Clients should seek financial advice regarding the appropriateness of investing in any security or investment strategy discussed in this presentation.
Certain economic and market information contained herein has been obtained from published sources prepared by other parties. Zacks Investment Management does not assume any responsibility for the accuracy or completeness of such information. Further, no third party has assumed responsibility for independently verifying the information contained herein and accordingly no such persons make any representations with respect to the accuracy, completeness or reasonableness of the information provided herein. Unless otherwise indicated, market analysis and conclusions are based upon opinions or assumptions that Zacks Investment Management considers to be reasonable. Any investment inherently involves a high degree of risk, beyond any specific risks discussed herein.
The S&P 500 Index is a well-known, unmanaged index of the prices of 500 large-company common stocks, mainly blue-chip stocks, selected by Standard & Poor’s. The S&P 500 Index assumes reinvestment of dividends but does not reflect advisory fees. The volatility of the benchmark may be materially different from the individual performance obtained by a specific investor. An investor cannot invest directly in an index.
The Russell 1000 Growth Index is a well-known, unmanaged index of the prices of 1000 large-company growth common stocks selected by Russell. The Russell 1000 Growth Index assumes reinvestment of dividends but does not reflect advisory fees. An investor cannot invest directly in an index. The volatility of the benchmark may be materially different from the individual performance obtained by a specific investor.
Nasdaq Composite Index is the market capitalization-weighted index of over 3,300 common equities listed on the Nasdaq stock exchange. The types of securities in the index include American depositary receipts, common stocks, real estate investment trusts (REITs) and tracking stocks, as well as limited partnership interests. The index includes all Nasdaq-listed stocks that are not derivatives, preferred shares, funds, exchange-traded funds (ETFs) or debenture securities. An investor cannot invest directly in an index. The volatility of the benchmark may be materially different from the individual performance obtained by a specific investor.
The Dow Jones Industrial Average measures the daily stock market movements of 30 U.S. publicly-traded companies listed on the NASDAQ or the New York Stock Exchange (NYSE). The 30 publicly-owned companies are considered leaders in the United States economy. An investor cannot directly invest in an index. The volatility of the benchmark may be materially different from the individual performance obtained by a specific investor.
The Bloomberg Global Aggregate Index is a flagship measure of global investment grade debt from twenty-four local currency markets. This multi-currency benchmark includes treasury, government-related, corporate and securitized fixed-rate bonds from both developed and emerging markets issuers. An investor cannot invest directly in an index. The volatility of the benchmark may be materially different from the individual performance obtained by a specific investor.
The ICE Exchange-Listed Fixed & Adjustable Rate Preferred Securities Index is a modified market capitalization weighted index composed of preferred stock and securities that are functionally equivalent to preferred stock including, but not limited to, depositary preferred securities, perpetual subordinated debt and certain securities issued by banks and other financial institutions that are eligible for capital treatment with respect to such instruments akin to that received for issuance of straight preferred stock. An investor cannot invest directly in an index. The volatility of the benchmark may be materially different from the individual performance obtained by a specific investor.