The U.S. economy posted two consecutive quarters of negative GDP growth in Q1 and Q2 of this year. While this technically meets the definition of a recession, a recession is not what the U.S. economy has endured.
The National Bureau of Economic Research (NBER) – which is the body that classifies recessions – did not declare one, because they also consider a wide range of factors beyond GDP, like productivity, gains or losses in the jobs market, and wages. These non-GDP fundamentals trended positive while output plateaued, signaling the economy was not necessarily ‘contracting’ but was more ‘holding its own.’1
Fast forward to Q3, and the U.S. economy grew by 2.6% according to last week’s initial release by the U.S. Commerce Department. Many naysayers point to the fact that a surge in exports contributed the most to the third quarter’s output, a temporary boost that will fade quickly, they say, and eventually, give way to the recession almost everyone is anticipating. We see this pattern a lot when sentiment is as negative as it is today – positive news gets ignored, framed as negative and/or temporary, or dismissed as a fluke. Yes, the economy grew, but “just wait.”
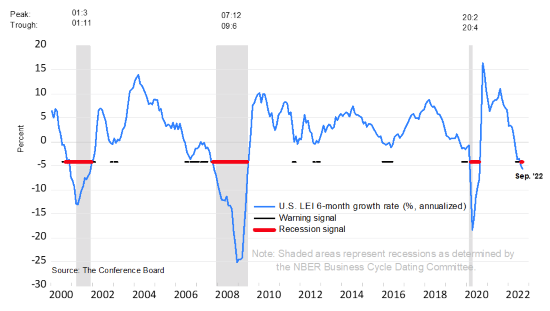
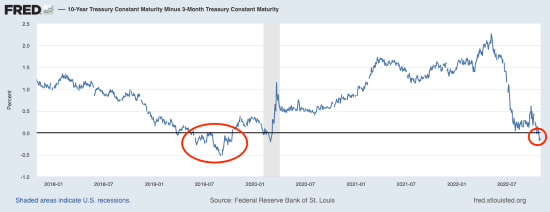
Regular readers of my column know I am not suggesting the U.S. economy will certainly avoid a recession in the coming quarters. My two preferred recession indicators—the 6-month growth rate for the Conference Board’s Leading Economic Index and the 10-year/3-month U.S. Treasury yield curve—are essentially signaling recession conditions ahead:
U.S. LEI 6-Month Growth Rate
U.S. Yield Curve (10-Year Treasury Bond Yield Minus 3-Month Treasury Bond Yield)
Where I differ from the mainstream is in assessing what the next recession could look like. Investors may hear in the news that massive layoffs are coming, the housing market is poised to implode, inflation and interest rates are heading higher, and all of this means we would be wise to prepare for an “economic hurricane.” The follow-on implication is usually that stocks have lower to go.
But in my view, these gloomy outlooks all make the same cognitive error that we see a lot in behavioral economics: recency bias. Memories of recent events – or in this case, recent recessions – will cause investors and economists to assume that the next recession will look like the last one. But that’s not always the case, and in fact, is rarely the case.
According to the National Bureau of Economic Research, there have been 34 recessions in the U.S. since 1857, and they have ranged from lasting two months to over 5 years – and everything in between. Sometimes unemployment goes up by a lot, sometimes it doesn’t. Sometimes output falls off a cliff, but other times the U.S. economy experiences a contraction so mild and quick that few people outside of the financial profession even notice.
Because the housing market is weakening, job openings are falling, and inflation and interest rates remain elevated, some assume that the U.S. economy could be headed for another Great Recession, on par with what we experienced from late 2007 to 2009. But that’s just recency bias at work, in my view.
I see far more signs that the U.S. could experience a mild recession versus a severe one – a so-called economic soft landing. In the latest GDP print, consumer spending – which accounts for close to two-thirds of total economic activity – edged higher, underscoring the U.S. consumers’ resilience in the face of rising inflation. Another key metric that measures underlying demand in the economy, called the final sales to private domestic purchasers, moved 0.1% higher in Q3 as compared to Q2. Banks’ balance sheets remain healthy, and the legacy of low-interest rates is keeping debt service costs historically low for a majority of Americans. There are also still more open jobs than there are unemployed Americans, a condition you do not see in economic hard times.
Economic conditions look nothing like they did during the Great Recession or leading up to it, and I seriously doubt they ever will in this cycle.
Bottom Line for Investors
Historically, recessions are best characterized by a decline in production and output, a rupture in the credit markets and household finances, and some amount of job loss. As I write, we have not seen any meaningful sign of these negative factors appearing yet.
That is not to say the U.S. economy will avoid recession. Leading economic indicators point to a weaker economy if not now, soon. But that does not mean the next recession has to be a severe one, where unemployment rises to double-digits as it did during the pandemic and also during the Great Recession. Economic contractions can take many forms, and investors should remember that the next one is not likely to look like the last one.
Disclosure
2 Conference Board. October 20, 2022. https://www.conference-board.org/topics/us-leading-indicators#:~:text=The%20Conference%20Board%20Leading%20Economic,over%20the%20previous%20six%20months
3 Fred Economic Data. October 31, 2022. https://fred.stlouisfed.org/series/T10Y3M#
DISCLOSURE
Past performance is no guarantee of future results. Inherent in any investment is the potential for loss.
Zacks Investment Management, Inc. is a wholly-owned subsidiary of Zacks Investment Research. Zacks Investment Management is an independent Registered Investment Advisory firm and acts as an investment manager for individuals and institutions. Zacks Investment Research is a provider of earnings data and other financial data to institutions and to individuals.
This material is being provided for informational purposes only and nothing herein constitutes investment, legal, accounting or tax advice, or a recommendation to buy, sell or hold a security. Do not act or rely upon the information and advice given in this publication without seeking the services of competent and professional legal, tax, or accounting counsel. Publication and distribution of this article is not intended to create, and the information contained herein does not constitute, an attorney-client relationship. No recommendation or advice is being given as to whether any investment or strategy is suitable for a particular investor. It should not be assumed that any investments in securities, companies, sectors or markets identified and described were or will be profitable. All information is current as of the date of herein and is subject to change without notice. Any views or opinions expressed may not reflect those of the firm as a whole.
Any projections, targets, or estimates in this report are forward looking statements and are based on the firm’s research, analysis, and assumptions. Due to rapidly changing market conditions and the complexity of investment decisions, supplemental information and other sources may be required to make informed investment decisions based on your individual investment objectives and suitability specifications. All expressions of opinions are subject to change without notice. Clients should seek financial advice regarding the appropriateness of investing in any security or investment strategy discussed in this presentation.
Certain economic and market information contained herein has been obtained from published sources prepared by other parties. Zacks Investment Management does not assume any responsibility for the accuracy or completeness of such information. Further, no third party has assumed responsibility for independently verifying the information contained herein and accordingly no such persons make any representations with respect to the accuracy, completeness or reasonableness of the information provided herein. Unless otherwise indicated, market analysis and conclusions are based upon opinions or assumptions that Zacks Investment Management considers to be reasonable. Any investment inherently involves a high degree of risk, beyond any specific risks discussed herein.
The S&P 500 Index is a well-known, unmanaged index of the prices of 500 large-company common stocks, mainly blue-chip stocks, selected by Standard & Poor’s. The S&P 500 Index assumes reinvestment of dividends but does not reflect advisory fees. The volatility of the benchmark may be materially different from the individual performance obtained by a specific investor. An investor cannot invest directly in an index.
The Russell 1000 Growth Index is a well-known, unmanaged index of the prices of 1000 large-company growth common stocks selected by Russell. The Russell 1000 Growth Index assumes reinvestment of dividends but does not reflect advisory fees. An investor cannot invest directly in an index. The volatility of the benchmark may be materially different from the individual performance obtained by a specific investor.
Nasdaq Composite Index is the market capitalization-weighted index of over 3,300 common equities listed on the Nasdaq stock exchange. The types of securities in the index include American depositary receipts, common stocks, real estate investment trusts (REITs) and tracking stocks, as well as limited partnership interests. The index includes all Nasdaq-listed stocks that are not derivatives, preferred shares, funds, exchange-traded funds (ETFs) or debenture securities. An investor cannot invest directly in an index. The volatility of the benchmark may be materially different from the individual performance obtained by a specific investor.
The Dow Jones Industrial Average measures the daily stock market movements of 30 U.S. publicly-traded companies listed on the NASDAQ or the New York Stock Exchange (NYSE). The 30 publicly-owned companies are considered leaders in the United States economy. An investor cannot directly invest in an index. The volatility of the benchmark may be materially different from the individual performance obtained by a specific investor.
The Bloomberg Global Aggregate Index is a flagship measure of global investment grade debt from twenty-four local currency markets. This multi-currency benchmark includes treasury, government-related, corporate and securitized fixed-rate bonds from both developed and emerging markets issuers. An investor cannot invest directly in an index. The volatility of the benchmark may be materially different from the individual performance obtained by a specific investor.
The ICE Exchange-Listed Fixed & Adjustable Rate Preferred Securities Index is a modified market capitalization weighted index composed of preferred stock and securities that are functionally equivalent to preferred stock including, but not limited to, depositary preferred securities, perpetual subordinated debt and certain securities issued by banks and other financial institutions that are eligible for capital treatment with respect to such instruments akin to that received for issuance of straight preferred stock. An investor cannot invest directly in an index. The volatility of the benchmark may be materially different from the individual performance obtained by a specific investor.