There is an ongoing debate in the financial world over whether the U.S. economy is headed for—or already experiencing—a period of stagflation. The ongoing war in Ukraine has only added to these fears. For readers who may not be familiar with the term, stagflation refers to an economic condition characterized by high inflation and falling and/or weak growth, sometimes with the accompaniment of high unemployment.
It should come as no surprise that stagflation is a material negative for equity markets. During quarters when the U.S. economy posted stagflation-like numbers, the S&P 500 has fallen a median -2.1%. That’s compared to the index’s median +2.5% quarterly increase when stagflation wasn’t present.1
The last instance when the U.S. economy endured stagflation was in the late 1960s and 1970s, which was also a time characterized by rising oil prices. Given tight oil supplies in the current environment coupled with the risks to energy markets tied to the war in Ukraine, some fear that the risk of stagflation in the U.S. and around the world is rising – and we could be headed for an outcome similar to the 1970s. Some readers may remember the S&P 500 experiencing a long and grinding bear market in 1973-1974.
Fortunately, comparisons to the 1970s do not have much merit, in my view. Inflation during the 1970s was roughly double what it is today, and the Fed ultimately raised interest rates to nearly 20% by 1980. Present-day, inflationary pressures are showing early signs of easing (more on that below), and the Fed has plans to raise the fed funds rate to about 2% by the end of the year, which is a far cry from where policy landed back in 1980. The 1970s also featured government price controls that constricted energy supply, which does not apply today.
That all being said, I do think it is worth examining whether stagflation risks are on the rise, which means taking a closer look at growth, employment, and inflation trends in the U.S.
I’ll start with growth. If the U.S. economy is on the verge of entering a slow patch, it is not yet evidenced in fundamental data. Leading economic indicators, as measured in the Conference Board’s Leading Economic Index (LEI), increased by 0.3% in February to 119.9. For scale, the LEI was at 100 in 2016, when the U.S. economy was firmly in growth mode. The U.S. economy has never entered a recession when LEI is high and rising, as it is now.2
Another key metric to look for when measuring economic activity is the U.S. Services PMI, given the U.S. is a service and consumption-based economy. In February, activity in the U.S. services sector grew for the 21st month in a row, registering at 56.5%. Any reading above 50 is expansionary, which again confirms the U.S. is currently in growth mode.
Finally, I think it’s important to look at the yield curve for clues as to whether growth conditions are present. A steepening yield curve is what investors should look for – it indicates that banks’ net interest margins are rising, which generally incentivizes loan growth and portends economic growth. A glance at the yield curve today – measured as the 10-year U.S. Treasury bond yield minus the 3-month Treasury bond yield – shows the curve is steepening, a good sign.
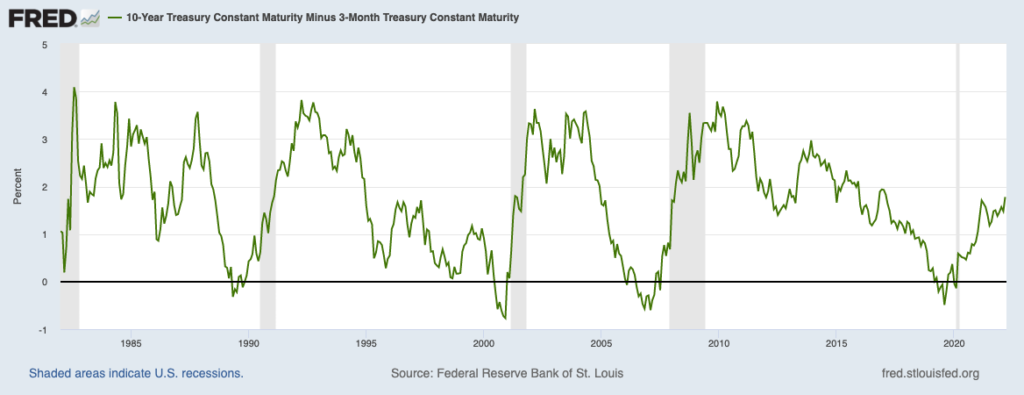
Source: Federal Reserve Bank of St. Louis3
On the employment front, nonfarm employment jumped by 678,000 in February, which was well above economists’ forecasts. November and December jobs numbers were also revised higher to 92,000, underscoring the modest impact the Omicron variant had on the U.S. labor market. At last measure, the U.S. unemployment rate sits at 3.8%, which marks a continued decline over the last several months even as the labor force participation rate has moved slightly higher. In the chart below, initial jobless claims – a proxy for layoffs – have steadied at close to pre-pandemic levels. Put simply, I do not see any stagflation signs in the labor market.

Source: Federal Reserve Bank of St. Louis4
Finally, there’s the inflation factor. In my view, there are two parts to the inflation story. The first is pandemic-induced inflation, which saw consumers shift purchases to goods versus services at a time when restrictions, factory closures, and labor shortages led to numerous kinks in global supply chains. Signs are emerging that these inflationary pressures are easing – shipping bottlenecks and supplier delivery times are falling, and the long lines of container ships at the U.S.’s biggest ports are shortening. I also think U.S. consumers are poised to shift spending back to services, which could ease pressures further.
The second part of the inflation story is what we are seeing now with higher commodity prices tied to the war, and also with workers exerting some leverage over wages. These two forces I believe could keep the U.S. in a longer period of elevated inflation, but not the dangerous kind – perhaps more in the 3% to 4% range, versus the desired 2%. Though the 10-year breakeven inflation rate is rising as seen in the chart below, it is still just at 3% – again, not necessarily a dangerous level for inflation.
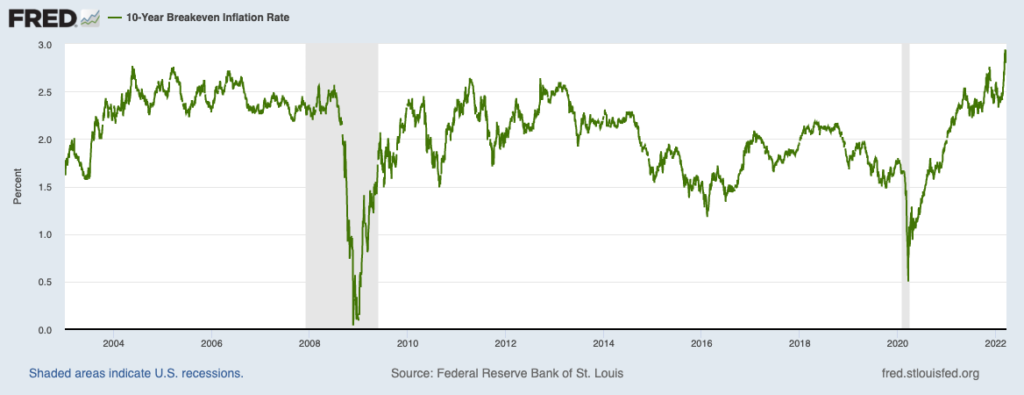
Source: Federal Reserve Bank of St. Louis5
Bottom Line for Investors
Inflation is present in the U.S. economy, and while some pressures are likely to ease as consumers shift spending to services and global supply chains normalize, the war in Ukraine could fuel a longer cycle of high commodity prices. This could cause inflation to settle at a rate higher than the target ~2%, which is what is causing many to raise stagflation worries.
But sustained inflation above 2% does not automatically imply stagflation – the U.S. economy remains on strong fundamental footing, jobs are plentiful, and I see plenty of growth ahead in 2022. The stock market can absorb slightly higher inflation if growth and earnings remain solid, which is what I see this year.
DISCLOSURE
2 The Conference Board. February 22, 2022. https://www.conference-board.org/data/bciarchive.cfm?cid=1
3 Fred Economic Data. March 21, 2022. https://fred.stlouisfed.org/series/T10Y3M
4 Fred Economic Data. March 17, 2022. https://fred.stlouisfed.org/series/ICSA#0
5 Fred Economic Data. March 22, 2022. https://fred.stlouisfed.org/series/T10YIE
DISCLOSURE
Past performance is no guarantee of future results. Inherent in any investment is the potential for loss.
Zacks Investment Management, Inc. is a wholly-owned subsidiary of Zacks Investment Research. Zacks Investment Management is an independent Registered Investment Advisory firm and acts as an investment manager for individuals and institutions. Zacks Investment Research is a provider of earnings data and other financial data to institutions and to individuals.
This material is being provided for informational purposes only and nothing herein constitutes investment, legal, accounting or tax advice, or a recommendation to buy, sell or hold a security. Do not act or rely upon the information and advice given in this publication without seeking the services of competent and professional legal, tax, or accounting counsel. Publication and distribution of this article is not intended to create, and the information contained herein does not constitute, an attorney-client relationship. No recommendation or advice is being given as to whether any investment or strategy is suitable for a particular investor. It should not be assumed that any investments in securities, companies, sectors or markets identified and described were or will be profitable. All information is current as of the date of herein and is subject to change without notice. Any views or opinions expressed may not reflect those of the firm as a whole.
Any projections, targets, or estimates in this report are forward looking statements and are based on the firm’s research, analysis, and assumptions. Due to rapidly changing market conditions and the complexity of investment decisions, supplemental information and other sources may be required to make informed investment decisions based on your individual investment objectives and suitability specifications. All expressions of opinions are subject to change without notice. Clients should seek financial advice regarding the appropriateness of investing in any security or investment strategy discussed in this presentation.
Certain economic and market information contained herein has been obtained from published sources prepared by other parties. Zacks Investment Management does not assume any responsibility for the accuracy or completeness of such information. Further, no third party has assumed responsibility for independently verifying the information contained herein and accordingly no such persons make any representations with respect to the accuracy, completeness or reasonableness of the information provided herein. Unless otherwise indicated, market analysis and conclusions are based upon opinions or assumptions that Zacks Investment Management considers to be reasonable. Any investment inherently involves a high degree of risk, beyond any specific risks discussed herein.
The S&P 500 Index is a well-known, unmanaged index of the prices of 500 large-company common stocks, mainly blue-chip stocks, selected by Standard & Poor’s. The S&P 500 Index assumes reinvestment of dividends but does not reflect advisory fees. The volatility of the benchmark may be materially different from the individual performance obtained by a specific investor. An investor cannot invest directly in an index.
The Russell 1000 Growth Index is a well-known, unmanaged index of the prices of 1000 large-company growth common stocks selected by Russell. The Russell 1000 Growth Index assumes reinvestment of dividends but does not reflect advisory fees. An investor cannot invest directly in an index. The volatility of the benchmark may be materially different from the individual performance obtained by a specific investor.
Nasdaq Composite Index is the market capitalization-weighted index of over 3,300 common equities listed on the Nasdaq stock exchange. The types of securities in the index include American depositary receipts, common stocks, real estate investment trusts (REITs) and tracking stocks, as well as limited partnership interests. The index includes all Nasdaq-listed stocks that are not derivatives, preferred shares, funds, exchange-traded funds (ETFs) or debenture securities. An investor cannot invest directly in an index. The volatility of the benchmark may be materially different from the individual performance obtained by a specific investor.
The Dow Jones Industrial Average measures the daily stock market movements of 30 U.S. publicly-traded companies listed on the NASDAQ or the New York Stock Exchange (NYSE). The 30 publicly-owned companies are considered leaders in the United States economy. An investor cannot directly invest in an index. The volatility of the benchmark may be materially different from the individual performance obtained by a specific investor.