With the Federal Reserve engaged in a bold monetary tightening campaign, many pundits and economists are debating whether the economy is headed for a “hard” or “soft” landing. In the post-World War II era, there have been three soft landings following a Fed rate hike campaign – 1965, 1984, and 1994. The difference between then and now, however, is that the Fed was trying to prevent inflation previously, versus its efforts today to reduce already high inflation.1
The inflation setup is a key differentiator. But I still think there’s a strong case for a soft landing in the current environment. The Fed needs inflation to come down, and to get there its main objectives are to slow GDP growth to around 2% or less, to bring some balance back into the too-tight labor markets, and to slow wage growth.
I think it’s possible to accomplish all three with a mild recession, not a severe one.
On the economic growth front, we’ve already seen softening GDP figures with earnings and earnings estimates coming down, signaling that the Federal Reserve and other global central bank measures are having at least some effect in reducing demand in the global economy. S&P 500 profit margins have also peaked, which generally implies an economic slowdown is underway or nearby. In the US housing market, 30-year fixed mortgage rates have shot past 6%, which has resulted in seven straight months of declines in existing home sales. Permits for future homebuilding have also plummeted to levels last seen in the spring of 2020.
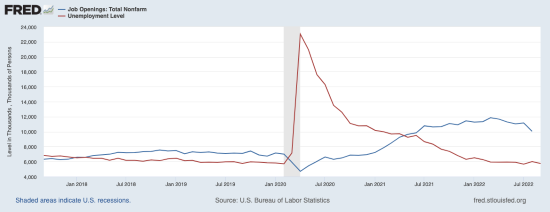
Regarding the rebalancing of supply and demand in the labor market, the optimistic view is that the Fed could theoretically achieve this goal by reducing the number of job openings instead of slowing the economy to the point of triggering layoffs. August employment data showed an early sign of this possibility, with total job openings falling by 10% to 10.1 million (see the dip in the blue line below). This figure still far exceeds the 6 million unemployed people looking for work (red line), so the real task here is closing the gap between the two. One month’s worth of data does not make a trend, but the 10% dip in job openings seems to be a meaningful step in the right direction.
September payrolls showed some further signs of cooling in the labor markets. Employers added 263,000 jobs in the month, which is a strong figure but notably smaller than the August increase of 315,000 and the 400,000 average gain over the first six months of 2022. Hourly wage growth was 5.0%, which is lower than August’s 5.2% gain and marked the slowest pace of increase since December 2021. Somewhat problematically, however, was that the number of people in the labor force fell, which brought the unemployment rate down to 3.5%. More labor is needed to ease wage pressures.3
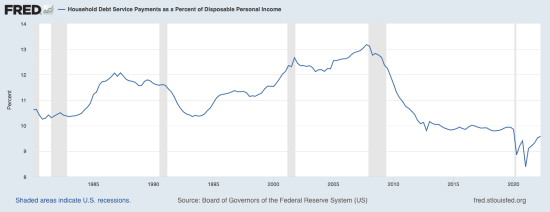
Other factors supporting an economic soft landing are strong fundamentals in the private sector and for households. The private sector has shown few signs that leverage is becoming an issue, and banks continue to report strong financial conditions. Households have spent down a decent portion of accumulated savings following the pandemic, but there is still approximately $1 trillion of net excess savings on balance sheets. The legacy of low-interest rates is also keeping debt service costs historically low for a majority of Americans, as seen in the chart below.
Bottom Line for Investors
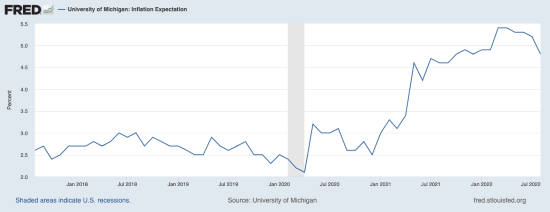
I think the next few months will start to show evidence that inflation pressures are easing, which should start to initiate conversations at the Fed about where the peak in interest rates may fall. On the inflation front, rents are falling month-over-month in many major markets, commodities are at a seven-month low and trading far from peaks, retail inventories are elevated which is forcing many retailers to cut prices, container freight rates are falling sharply, and the US ISM Manufacturing Prices Paid Index is currently at 51.70—down -36.33% from a year ago. All of these factors point to reduced inflationary pressure in the months ahead, which also coincides with inflation expectations as seen on the chart below:
The key for markets is if the peak in inflation comes before the Fed has gone too far with rates, which would significantly increase the chances we get a soft economic landing. Falling inflation could also be good for stocks – throughout history, stocks fall as inflation approaches a peak, but they rebound strongly once inflation starts to come down. I think we’re getting close to this point.
Disclosure
2 Fred Economic Data. October 4, 2022. https://fred.stlouisfed.org/series/JTSJOL
3 Wall Street Journal. October 7, 2022. https://www.wsj.com/articles/september-jobs-report-unemployment-rate-economy-growth-2022-11665091101
4 Fred Economic Data. September 30, 2022. https://fred.stlouisfed.org/series/MICH
5 Fred Economic Data. September 30, 2022. https://fred.stlouisfed.org/series/MICH#
DISCLOSURE
Past performance is no guarantee of future results. Inherent in any investment is the potential for loss.
Zacks Investment Management, Inc. is a wholly-owned subsidiary of Zacks Investment Research. Zacks Investment Management is an independent Registered Investment Advisory firm that acts as an investment manager for individuals and institutions. Zacks Investment Research is a provider of earnings data and other financial data to institutions and to individuals.
This material is being provided for informational purposes only and nothing herein constitutes investment, legal, accounting or tax advice, or a recommendation to buy, sell or hold a security. Do not act or rely upon the information and advice given in this publication without seeking the services of competent and professional legal, tax, or accounting counsel. Publication and distribution of this article is not intended to create, and the information contained herein does not constitute, an attorney-client relationship. No recommendation or advice is being given as to whether any investment or strategy is suitable for a particular investor. It should not be assumed that any investments in securities, companies, sectors or markets identified and described were or will be profitable. All information is current as of the date of herein and is subject to change without notice. Any views or opinions expressed may not reflect those of the firm as a whole.
Any projections, targets, or estimates in this report are forward looking statements and are based on the firm’s research, analysis, and assumptions. Due to rapidly changing market conditions and the complexity of investment decisions, supplemental information and other sources may be required to make informed investment decisions based on your individual investment objectives and suitability specifications. All expressions of opinions are subject to change without notice. Clients should seek financial advice regarding the appropriateness of investing in any security or investment strategy discussed in this presentation.
Certain economic and market information contained herein has been obtained from published sources prepared by other parties. Zacks Investment Management does not assume any responsibility for the accuracy or completeness of such information. Further, no third party has assumed responsibility for independently verifying the information contained herein and accordingly no such persons make any representations with respect to the accuracy, completeness or reasonableness of the information provided herein. Unless otherwise indicated, market analysis and conclusions are based upon opinions or assumptions that Zacks Investment Management considers to be reasonable. Any investment inherently involves a high degree of risk, beyond any specific risks discussed herein.
The S&P 500 Index is a well-known, unmanaged index of the prices of 500 large-company common stocks, mainly blue-chip stocks, selected by Standard & Poor’s. The S&P 500 Index assumes reinvestment of dividends but does not reflect advisory fees. The volatility of the benchmark may be materially different from the individual performance obtained by a specific investor. An investor cannot invest directly in an index.
The Russell 1000 Growth Index is a well-known, unmanaged index of the prices of 1000 large-company growth common stocks selected by Russell. The Russell 1000 Growth Index assumes reinvestment of dividends but does not reflect advisory fees. An investor cannot invest directly in an index. The volatility of the benchmark may be materially different from the individual performance obtained by a specific investor.
Nasdaq Composite Index is the market capitalization-weighted index of over 3,300 common equities listed on the Nasdaq stock exchange. The types of securities in the index include American depositary receipts, common stocks, real estate investment trusts (REITs) and tracking stocks, as well as limited partnership interests. The index includes all Nasdaq-listed stocks that are not derivatives, preferred shares, funds, exchange-traded funds (ETFs) or debenture securities. An investor cannot invest directly in an index. The volatility of the benchmark may be materially different from the individual performance obtained by a specific investor.
The Dow Jones Industrial Average measures the daily stock market movements of 30 U.S. publicly-traded companies listed on the NASDAQ or the New York Stock Exchange (NYSE). The 30 publicly-owned companies are considered leaders in the United States economy. An investor cannot directly invest in an index. The volatility of the benchmark may be materially different from the individual performance obtained by a specific investor.
The Bloomberg Global Aggregate Index is a flagship measure of global investment grade debt from twenty-four local currency markets. This multi-currency benchmark includes treasury, government-related, corporate and securitized fixed-rate bonds from both developed and emerging markets issuers. An investor cannot invest directly in an index. The volatility of the benchmark may be materially different from the individual performance obtained by a specific investor.
The ICE Exchange-Listed Fixed & Adjustable Rate Preferred Securities Index is a modified market capitalization weighted index composed of preferred stock and securities that are functionally equivalent to preferred stock including, but not limited to, depositary preferred securities, perpetual subordinated debt and certain securities issued by banks and other financial institutions that are eligible for capital treatment with respect to such instruments akin to that received for issuance of straight preferred stock. An investor cannot invest directly in an index. The volatility of the benchmark may be materially different from the individual performance obtained by a specific investor.