Is the Stock Market Too Optimistic About Rate Cuts?
It’s all about the Fed, again.
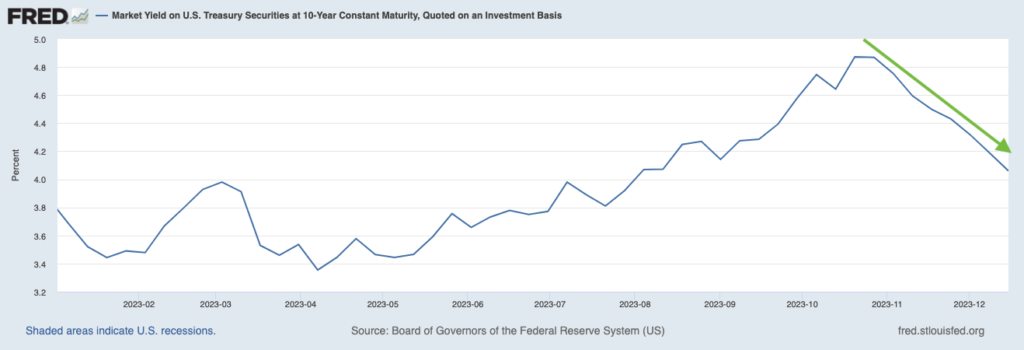
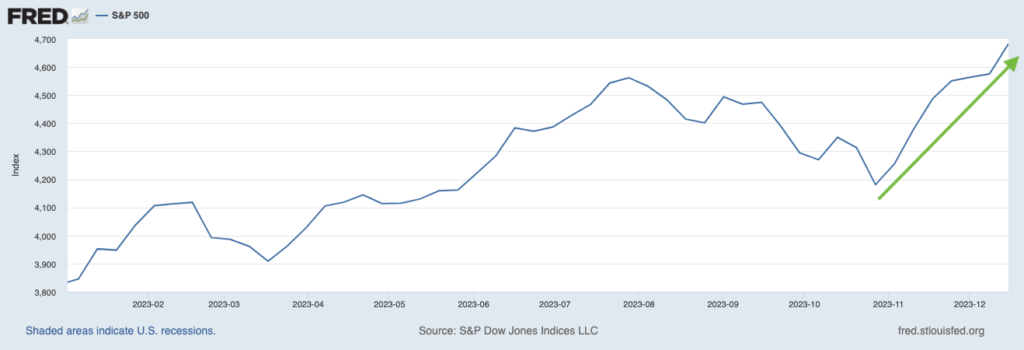
The stock and bond markets have both delivered powerful rallies in recent weeks. The move in stocks has been broad-based, with everything from small-cap stocks to mega-cap tech names performing well. Meanwhile, yields on the 10-year U.S. Treasury bond have sharply declined from near 5% levels in mid-October to sub 4% levels as I write (charts below).1
Bond prices have risen as yields have declined since October
And stocks have surged over the past two months
Nearly every expert investor, economist, or financial media pundit will tell you the rallies are tied to the Fed “pause” in interest rate increases, and also to the market’s increasingly dovish expectation for rate cuts in 2024. I’m not here to tell you these experts are wrong. But I do think investors should think about the market and economic outlook in a more nuanced way. Which is to say, remember that the Fed isn’t the only factor driving stock market trends.
Let me first be fair, though. Fed policy does matter. At the December 12-13 Federal Reserve meeting, officials voted unanimously to hold rates steady, as expected. But what came as a positive surprise was the decision to publish interest rate projections for the following year, which penciled in three quarter-point rate cuts. Markets rallied. The Fed also expressed fairly clearly that fighting inflation was no longer their sole mission, but that they were also focused on growth and employment. In Fed Chairman Jerome Powell’s words: “You’re getting now back to the point where both mandates [inflation and unemployment] are important,” adding that “We’ll be very much keeping that in mind as we make policy going forward.”
Following this meeting, the market seemed to be pricing in not only the possibility, but the probability of a soft economic landing with a continued downtrend in inflation—which are the conditions needed for the Fed to proceed with cuts.
But the questions investors need to be asking now are: What happens if the economy grows much more strongly than anticipated? Or what if inflation is a bit stickier than expected, due perhaps to a persistently strong labor market and rising wages and spending?
Recall that at the outset of 2023, nearly 100% of economists were calling for an economic recession. It never happened. Instead, the U.S. economy posted GDP growth of 2.2% in Q1, 2.1% in Q2, and a staggering 5.2% in Q3, while adding an average of 240,000 jobs per month. If pretty much everyone was wrong about the recession in 2023, it’s also possible the ‘herd mentality’ about rate cuts in 2024 is also misplaced. After all, Fed ‘dot plots’ in recent years have routinely been way off the mark.4
In other words, the market seems to be telling us that rate cuts are needed to sustain the rally. But I disagree.
I think inflation will slowly but surely continue in a downtrend, which should reaffirm the Fed’s stance on “pausing” rate increases. But I also think the economy could remain fundamentally stronger than most expect, which may also motivate the Fed to hold rates steady versus cutting too soon. In this latter outcome, the market technically won’t get what it wants (rate cuts), and short-term volatility may ensue. But the bottom line would be that the economy is fundamentally strong, which in the medium- to long-term is what will help drive earnings. And that’s what matters most.
Bottom Line for Investors
Markets are not ‘making up’ the possibility of rate cuts in 2024. Fed officials have indicated as much, with the median policy maker’s “dot” forecast for the benchmark Fed funds rate sitting at 4.6% (from the current 5.1%) by the end of next year.
The issue is that the Fed funds futures market is pricing in a 100% chance of rate cuts next year, which seems to indicate that there is way too much confidence in the Fed’s interest rate projections. As mentioned before, “dot” plot forecasts in recent years have been routinely wrong, sometimes by a lot.
If the market doesn’t get what it wants in terms of rate cuts, that could drive volatility. Investors should expect that. But at the end of the day, a strong fundamental economy and rising earnings matter far more than whether the Fed cuts rates two or three times in the new year. Becoming “Fed obsessed” is easy given all the attention the Fed gets, but investors should remember not to overlook the other critical data driving the investment decision-making process – growth, employment, and earnings.
Disclosure
2 Fred Economic Data. December 18, 2023. https://fred.stlouisfed.org/series/DGS10#
3 Fred Economic Data. December 19, 2023. https://fred.stlouisfed.org/series/DGS10#
4 Wall Street Journal. December 14, 2023. https://www.wsj.com/economy/central-banking/fed-fueled-rally-extends-gains-in-stocks-bonds-ec5e2139?mod=economy_lead_pos5
DISCLOSURE
Past performance is no guarantee of future results. Inherent in any investment is the potential for loss.
Zacks Investment Management, Inc. is a wholly-owned subsidiary of Zacks Investment Research. Zacks Investment Management is an independent Registered Investment Advisory firm and acts as an investment manager for individuals and institutions. Zacks Investment Research is a provider of earnings data and other financial data to institutions and to individuals.
This material is being provided for informational purposes only and nothing herein constitutes investment, legal, accounting or tax advice, or a recommendation to buy, sell or hold a security. Do not act or rely upon the information and advice given in this publication without seeking the services of competent and professional legal, tax, or accounting counsel. Publication and distribution of this article is not intended to create, and the information contained herein does not constitute, an attorney-client relationship. No recommendation or advice is being given as to whether any investment or strategy is suitable for a particular investor. It should not be assumed that any investments in securities, companies, sectors or markets identified and described were or will be profitable. All information is current as of the date of herein and is subject to change without notice. Any views or opinions expressed may not reflect those of the firm as a whole.
Any projections, targets, or estimates in this report are forward looking statements and are based on the firm’s research, analysis, and assumptions. Due to rapidly changing market conditions and the complexity of investment decisions, supplemental information and other sources may be required to make informed investment decisions based on your individual investment objectives and suitability specifications. All expressions of opinions are subject to change without notice. Clients should seek financial advice regarding the appropriateness of investing in any security or investment strategy discussed in this presentation.
Certain economic and market information contained herein has been obtained from published sources prepared by other parties. Zacks Investment Management does not assume any responsibility for the accuracy or completeness of such information. Further, no third party has assumed responsibility for independently verifying the information contained herein and accordingly no such persons make any representations with respect to the accuracy, completeness or reasonableness of the information provided herein. Unless otherwise indicated, market analysis and conclusions are based upon opinions or assumptions that Zacks Investment Management considers to be reasonable. Any investment inherently involves a high degree of risk, beyond any specific risks discussed herein.
The S&P 500 Index is a well-known, unmanaged index of the prices of 500 large-company common stocks, mainly blue-chip stocks, selected by Standard & Poor’s. The S&P 500 Index assumes reinvestment of dividends but does not reflect advisory fees. The volatility of the benchmark may be materially different from the individual performance obtained by a specific investor. An investor cannot invest directly in an index.
The Russell 1000 Growth Index is a well-known, unmanaged index of the prices of 1000 large-company growth common stocks selected by Russell. The Russell 1000 Growth Index assumes reinvestment of dividends but does not reflect advisory fees. An investor cannot invest directly in an index. The volatility of the benchmark may be materially different from the individual performance obtained by a specific investor.
Nasdaq Composite Index is the market capitalization-weighted index of over 3,300 common equities listed on the Nasdaq stock exchange. The types of securities in the index include American depositary receipts, common stocks, real estate investment trusts (REITs) and tracking stocks, as well as limited partnership interests. The index includes all Nasdaq-listed stocks that are not derivatives, preferred shares, funds, exchange-traded funds (ETFs) or debenture securities. An investor cannot invest directly in an index. The volatility of the benchmark may be materially different from the individual performance obtained by a specific investor.
The Dow Jones Industrial Average measures the daily stock market movements of 30 U.S. publicly-traded companies listed on the NASDAQ or the New York Stock Exchange (NYSE). The 30 publicly-owned companies are considered leaders in the United States economy. An investor cannot directly invest in an index. The volatility of the benchmark may be materially different from the individual performance obtained by a specific investor.
The Bloomberg Global Aggregate Index is a flagship measure of global investment grade debt from twenty-four local currency markets. This multi-currency benchmark includes treasury, government-related, corporate and securitized fixed-rate bonds from both developed and emerging markets issuers. An investor cannot invest directly in an index. The volatility of the benchmark may be materially different from the individual performance obtained by a specific investor.
The ICE Exchange-Listed Fixed & Adjustable Rate Preferred Securities Index is a modified market capitalization weighted index composed of preferred stock and securities that are functionally equivalent to preferred stock including, but not limited to, depositary preferred securities, perpetual subordinated debt and certain securities issued by banks and other financial institutions that are eligible for capital treatment with respect to such instruments akin to that received for issuance of straight preferred stock. An investor cannot invest directly in an index. The volatility of the benchmark may be materially different from the individual performance obtained by a specific investor.
The MSCI ACWI ex U.S. Index captures large and mid-cap representation across 22 of 23 Developed Markets (DM) countries (excluding the United States) and 24 Emerging Markets (EM) countries. The index covers approximately 85% of the global equity opportunity set outside the U.S. An investor cannot invest directly in an index. The volatility of the benchmark may be materially different from the individual performance obtained by a specific investor.
The Russell 2000 Index is a well-known, unmanaged index of the prices of 2000 small-cap company common stocks, selected by Russell. The Russell 2000 Index assumes reinvestment of dividends but does not reflect advisory fees. An investor cannot invest directly in an index. The volatility of the benchmark may be materially different from the individual performance obtained by a specific investor.
The S&P Mid Cap 400 provides investors with a benchmark for mid-sized companies. The index, which is distinct from the large-cap S&P 500, is designed to measure the performance of 400 mid-sized companies, reflecting the distinctive risk and return characteristics of this market segment.
The S&P 500 Pure Value index is a style-concentrated index designed to track the performance of stocks that exhibit the strongest value characteristics by using a style-attractiveness-weighting scheme. An investor cannot directly invest in an index. The volatility of the benchmark may be materially different from the individual performance obtained by a specific investor.