4 Factors that Should Stay on Investor Radars in 2024
2023 was quite the year. At its outset, 100% of economists were predicting that the U.S. would enter a recession. I floated the possibility that the U.S. could skirt recession but felt that the most likely outcome would be a very mild, shallow contraction.
The U.S. economy defied all expectations and grew all year, and the stock market responded in kind with strong double-digit gains for the year. But 2023 was far from a smooth and easy ride. A regional banking crisis sparked fears of a broader financial contagion, debt ceiling drama weighed on sentiment and markets, sharply rising interest rates triggered a market correction, and another war broke out. There were plenty of bricks in the wall of worry trying to throw investors off course, but patience and a steady hand paid off.1
With one day left in the year, it’s time for investors to look ahead and think about what factors should be tracked when assessing the economic and market environment. Below I give you four.
1. An Earnings Rebound, But Will It Be Enough?
Though spending has been strong in Q4 and the economy is expected to expand at a solid pace, earnings estimates have been steadily coming down in recent weeks (see chart below). These revised estimates are bigger on the downside compared to what we had seen in the comparable periods for either of the preceding two quarters and also mark a reversal from the favorable revisions we were seeing earlier in the year – something to keep an eye on. Total S&P 500 earnings are now expected to be -0.2% below the year-earlier period, on +2.3% higher revenues.
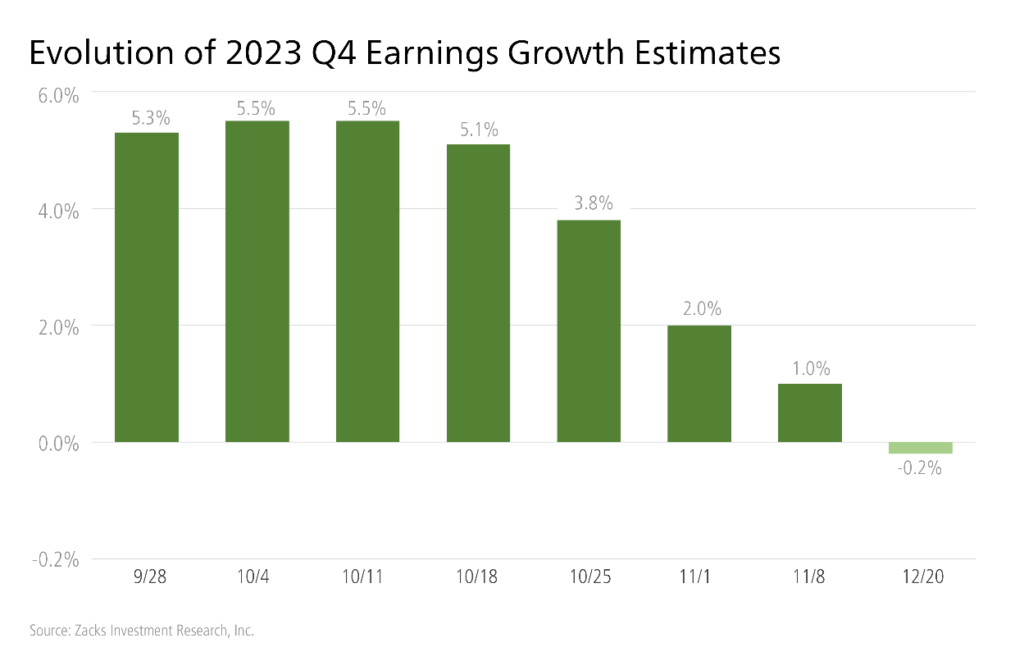
As you can see in the chart below, the Q4 earnings dip is expected to be temporary, with compelling earnings rebound playing out in 2024. The key for investors to watch is whether corporations live up to these expectations, and how estimates get revised over the course of the year. Markets like “better than expected.”

2. Inflation’s Last Mile
The November PCE Price Index (the Fed’s preferred inflation gauge) came in at 2.6% year-over-year, signaling that progress on inflation continues but still has a bit more to go. Where could the final down-leg of inflation come from? Housing costs.
About 75% of all the year-on-year change in inflation (measured by CPI) has come from U.S. shelter prices. Most readers are aware of rising home prices over the past few years, which has fed into a higher ‘owner’s equivalent rent’ number for inflation. But a quirk in the inflation calculation also factors in new and existing leases, the latter of which has experienced acute price pressures. New leases have seen significant softening, however, with rent growth declining to 3.3% through November, according to Zillow. That’s lower than the average rent increases in the two years preceding the pandemic.
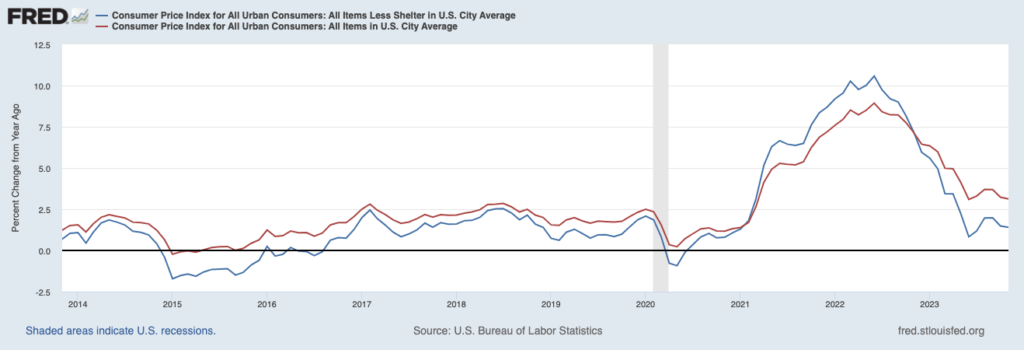
The next chart shows why housing costs are so important. If you look at CPI minus the shelter component, inflation went up a meager 1.4% year-over-year in November, which is below the Fed’s target.
When removing housing costs from CPI (blue line), inflation is running below 2%
I expect inflation to continue in the right direction in 2024, but I think it’s also worth considering that the inflation rate could settle at a higher level than we’ve become accustomed to seeing. Think 2.5% to 3% versus 1.5% to 2.5%, which I think could be influenced by the energy transition and industrial policy putting a higher floor on commodities prices, as well as the shifting trend in globalization known as “nearshoring,” where countries are moving supply chains closer to home.
3. Economic Growth and Jobs (Looked at Together)
U.S. GDP expanded by 2.2% in Q1, 2.1% in Q2, and 5.2% in Q3, and the economy added an average of 240,000 jobs per month over through November. And, as I write, the Atlanta Federal Reserve’s GDPNow forecasting tool is showing 2.7% GDP growth in Q4, which I think is pretty well substantiated in the strong consumer spending data we’ve seen this holiday season.
The question is not really whether the U.S. economy will grow in Q4, however. It’s how fast or slow the economy expands in the new year, and whether strength in the jobs market will continue to ease. The recipe for rate cuts in the new year is if the economy grows modestly or more slowly than expected, while the unemployment rate gradually ticks higher. It’s this soft landing that we ideally want to see.
4. Eyeing Stress in the Credit Markets
Anytime interest rates rise quickly, as they did in 2023, it’s only a matter of time before pockets of the credit markets start to feel the tightness. A key example that made headlines in 2023 – and appears likely to make even more headlines in the new year – is commercial real estate debt. There’s about $4.5 trillion in outstanding commercial real estate debt, with about half of its floating rate, and due to mature in 2025. That means when that debt is up for refinancing, it will be at much higher rates.
About 14% of commercial real estate is in the office sector, which has struggled mightily to recover from the pandemic and the work-from-home/hybrid work movement. I’d expect to see default rates increase in this space in the coming year. The upshot is that I do not think these pockets of weakness and defaults will result in a full-on credit crunch, especially given strong corporate cash flows and the Fed’s stance of being ready to lower rates if signs of economic trouble emerge. Still, this will be a factor to watch closely in the new year.
Bottom Line for Investors
My list above is by no means exhaustive. There are geopolitical concerns that could influence capital markets in the new year, a highly anticipated U.S. presidential election, likely another showdown over the debt and deficit spending, and a whole range of unpredictable events and perhaps crises that could serve as headwinds to growth.
But remember that apart from the U.S. presidential election, the stock market endured all of those other things in 2023 and still managed to post very solid double-digit returns. I’m hopeful for more of the same in 2024.
Disclosure
2 Zacks. December 20, 2023. https://www.zacks.com/commentary/2200741/q4-earnings-loom-what-to-expect
3 Fred Economic Data. December 12, 2023. https://fred.stlouisfed.org/series/CUSR0000SA0L2#
DISCLOSURE
Past performance is no guarantee of future results. Inherent in any investment is the potential for loss.
Zacks Investment Management, Inc. is a wholly-owned subsidiary of Zacks Investment Research. Zacks Investment Management is an independent Registered Investment Advisory firm and acts as an investment manager for individuals and institutions. Zacks Investment Research is a provider of earnings data and other financial data to institutions and to individuals.
This material is being provided for informational purposes only and nothing herein constitutes investment, legal, accounting or tax advice, or a recommendation to buy, sell or hold a security. Do not act or rely upon the information and advice given in this publication without seeking the services of competent and professional legal, tax, or accounting counsel. Publication and distribution of this article is not intended to create, and the information contained herein does not constitute, an attorney-client relationship. No recommendation or advice is being given as to whether any investment or strategy is suitable for a particular investor. It should not be assumed that any investments in securities, companies, sectors or markets identified and described were or will be profitable. All information is current as of the date of herein and is subject to change without notice. Any views or opinions expressed may not reflect those of the firm as a whole.
Any projections, targets, or estimates in this report are forward looking statements and are based on the firm’s research, analysis, and assumptions. Due to rapidly changing market conditions and the complexity of investment decisions, supplemental information and other sources may be required to make informed investment decisions based on your individual investment objectives and suitability specifications. All expressions of opinions are subject to change without notice. Clients should seek financial advice regarding the appropriateness of investing in any security or investment strategy discussed in this presentation.
Certain economic and market information contained herein has been obtained from published sources prepared by other parties. Zacks Investment Management does not assume any responsibility for the accuracy or completeness of such information. Further, no third party has assumed responsibility for independently verifying the information contained herein and accordingly no such persons make any representations with respect to the accuracy, completeness or reasonableness of the information provided herein. Unless otherwise indicated, market analysis and conclusions are based upon opinions or assumptions that Zacks Investment Management considers to be reasonable. Any investment inherently involves a high degree of risk, beyond any specific risks discussed herein.
The S&P 500 Index is a well-known, unmanaged index of the prices of 500 large-company common stocks, mainly blue-chip stocks, selected by Standard & Poor’s. The S&P 500 Index assumes reinvestment of dividends but does not reflect advisory fees. The volatility of the benchmark may be materially different from the individual performance obtained by a specific investor. An investor cannot invest directly in an index.
The Russell 1000 Growth Index is a well-known, unmanaged index of the prices of 1000 large-company growth common stocks selected by Russell. The Russell 1000 Growth Index assumes reinvestment of dividends but does not reflect advisory fees. An investor cannot invest directly in an index. The volatility of the benchmark may be materially different from the individual performance obtained by a specific investor.
Nasdaq Composite Index is the market capitalization-weighted index of over 3,300 common equities listed on the Nasdaq stock exchange. The types of securities in the index include American depositary receipts, common stocks, real estate investment trusts (REITs) and tracking stocks, as well as limited partnership interests. The index includes all Nasdaq-listed stocks that are not derivatives, preferred shares, funds, exchange-traded funds (ETFs) or debenture securities. An investor cannot invest directly in an index. The volatility of the benchmark may be materially different from the individual performance obtained by a specific investor.
The Dow Jones Industrial Average measures the daily stock market movements of 30 U.S. publicly-traded companies listed on the NASDAQ or the New York Stock Exchange (NYSE). The 30 publicly-owned companies are considered leaders in the United States economy. An investor cannot directly invest in an index. The volatility of the benchmark may be materially different from the individual performance obtained by a specific investor.
The Bloomberg Global Aggregate Index is a flagship measure of global investment grade debt from twenty-four local currency markets. This multi-currency benchmark includes treasury, government-related, corporate and securitized fixed-rate bonds from both developed and emerging markets issuers. An investor cannot invest directly in an index. The volatility of the benchmark may be materially different from the individual performance obtained by a specific investor.
The ICE Exchange-Listed Fixed & Adjustable Rate Preferred Securities Index is a modified market capitalization weighted index composed of preferred stock and securities that are functionally equivalent to preferred stock including, but not limited to, depositary preferred securities, perpetual subordinated debt and certain securities issued by banks and other financial institutions that are eligible for capital treatment with respect to such instruments akin to that received for issuance of straight preferred stock. An investor cannot invest directly in an index. The volatility of the benchmark may be materially different from the individual performance obtained by a specific investor.
The MSCI ACWI ex U.S. Index captures large and mid-cap representation across 22 of 23 Developed Markets (DM) countries (excluding the United States) and 24 Emerging Markets (EM) countries. The index covers approximately 85% of the global equity opportunity set outside the U.S. An investor cannot invest directly in an index. The volatility of the benchmark may be materially different from the individual performance obtained by a specific investor.
The Russell 2000 Index is a well-known, unmanaged index of the prices of 2000 small-cap company common stocks, selected by Russell. The Russell 2000 Index assumes reinvestment of dividends but does not reflect advisory fees. An investor cannot invest directly in an index. The volatility of the benchmark may be materially different from the individual performance obtained by a specific investor.
The S&P Mid Cap 400 provides investors with a benchmark for mid-sized companies. The index, which is distinct from the large-cap S&P 500, is designed to measure the performance of 400 mid-sized companies, reflecting the distinctive risk and return characteristics of this market segment.
The S&P 500 Pure Value index is a style-concentrated index designed to track the performance of stocks that exhibit the strongest value characteristics by using a style-attractiveness-weighting scheme. An investor cannot directly invest in an index. The volatility of the benchmark may be materially different from the individual performance obtained by a specific investor.