Timeless Investment Lessons from a Great Thinker
“All of us would be better investors if we just made fewer decisions.”
Those were words frequently spoken by Daniel Kahneman, a Nobel prize-winning psychologist who passed away last week. Kahneman won the Nobel Prize in economic science in 2002. But interestingly enough, he never once took an economics course. Instead, Kahneman was focused on behavior—how humans’ hard-wired mental biases cause us to make poor decisions and/or behave irrationally.1
If there’s truth to the statement that ‘investors are their own worst enemies,’ which I personally believe to be the case, Kahneman spent most of his career trying to figure out why.
All of the discoveries he made along the way created an entirely new field within economics, called behavioral economics. Kahneman upended the theory that people act rationally, in their own self-interest, and with consistent preferences when making decisions. In fact, his research found that investors often do just the opposite.
Kahneman recognized that investors often make—and repeat—the same mistakes over time. For instance:
• Why do investors seem to sell winners too early and hold onto losing positions too long?
• Why do we think a few smart trades all of a sudden deems us an immutable expert (instead of just lucky)?
• Why are many investors compelled to make decisions with low probability of success, like betting big on a “hot stock”?
• And, perhaps most critically, why do we feel differently about losses than we do gains?
The last point was developed into a theory that helps explain loss aversion. Here’s a hypothetical example of how it works. Investor A has a $1,000,000 portfolio that grows by 30% in a single year, and in a straight line, ending at $1,300,000. Investor B has a $1,000,000 that books a 50% gain in the first 11 months but then falls 20% in December, also ending the year at $1,300,000.
Given that both Investor A and Investor B end up in the same place, it objectively should not matter which investor you’d rather be. But almost all investors would prefer to be Investor A, since that portfolio did not experience any losses along the way. Put another way, if you were to ask a big group if they’d be willing to take a risk with an 80% chance of success, most would say yes. But if you ask the same group about their willingness to take the same exact risk but with a 20% chance of failure, many would pass.
It’s this aversion to losses that can easily lead to poor judgment over time. Because investors loathe losses about twice as much as they appreciate gains, they tend to try and guard against those losses—often in the wrong ways and at the wrong times.
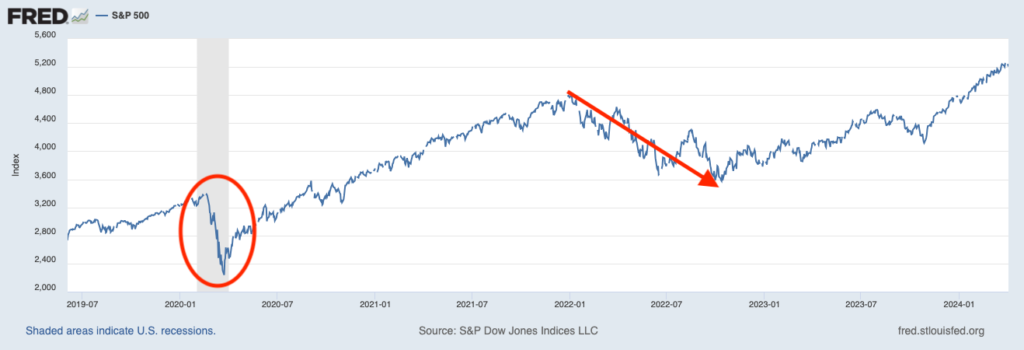
Looking at the chart of the S&P 500 below from mid-2019 to present day, we can see that the S&P 500 has booked an approximately +75% gain. But it’s also true that there was a sharp and scary bear market in 2020 with the pandemic, and a drawn-out bear market in 2022 when inflation soared. Loss aversion may have caused some investors to get out of the market during these years, when ‘making fewer decisions’ would have arguably resulted in a better outcome.
Bottom Line for Investors
Kahneman’s work illuminated loss aversion and many other biases, all of which make investors act irrationally, against their own interests, and with ever-shifting strategies and goals—the opposite of how investors should behave.
Recognizing and understanding these biases gives investors the tools needed to keep a steady hand and make decisions rationally, and thoughtfully. If sharp downside volatility in the market has you thinking you need to sell stocks and get out, remember that your mind is essentially hardwired to exaggerate this negative impact. If you change your asset allocation as a result, running counter to your long-term goals, there’s an argument that you’re actually adding risk to your portfolio, not taking it away. This is irrational behavior.
Investors tend to characterize short-term occurrences—like a rapid run-up in a stock’s price—as sufficient data for predicting what will happen next. That’s why “chasing heat” is such a widely-known term. This leads to all sorts of bad traits for investors—overconfidence, thin research, subjectivity, and many, many others.
Kahneman suggested that the key question to ask before making an investment decision is, what is the base rate? This means prefacing every important decision by establishing the objective odds of success, based largely on history. In equity market terms, and in its simplest form, investors might ask themselves how often the stock market delivers attractive returns in 10-, 20-, or 30-year periods. The answer, of course, is nearly 100% of the time.
Disclosure
2 Fred Economic Data. April 2, 2024. https://fred.stlouisfed.org/series/SP500#
DISCLOSURE
Past performance is no guarantee of future results. Inherent in any investment is the potential for loss.
Zacks Investment Management, Inc. is a wholly-owned subsidiary of Zacks Investment Research. Zacks Investment Management is an independent Registered Investment Advisory firm and acts as an investment manager for individuals and institutions. Zacks Investment Research is a provider of earnings data and other financial data to institutions and to individuals.
This material is being provided for informational purposes only and nothing herein constitutes investment, legal, accounting or tax advice, or a recommendation to buy, sell or hold a security. Do not act or rely upon the information and advice given in this publication without seeking the services of competent and professional legal, tax, or accounting counsel. Publication and distribution of this article is not intended to create, and the information contained herein does not constitute, an attorney-client relationship. No recommendation or advice is being given as to whether any investment or strategy is suitable for a particular investor. It should not be assumed that any investments in securities, companies, sectors or markets identified and described were or will be profitable. All information is current as of the date of herein and is subject to change without notice. Any views or opinions expressed may not reflect those of the firm as a whole.
Any projections, targets, or estimates in this report are forward looking statements and are based on the firm’s research, analysis, and assumptions. Due to rapidly changing market conditions and the complexity of investment decisions, supplemental information and other sources may be required to make informed investment decisions based on your individual investment objectives and suitability specifications. All expressions of opinions are subject to change without notice. Clients should seek financial advice regarding the appropriateness of investing in any security or investment strategy discussed in this presentation.
Certain economic and market information contained herein has been obtained from published sources prepared by other parties. Zacks Investment Management does not assume any responsibility for the accuracy or completeness of such information. Further, no third party has assumed responsibility for independently verifying the information contained herein and accordingly no such persons make any representations with respect to the accuracy, completeness or reasonableness of the information provided herein. Unless otherwise indicated, market analysis and conclusions are based upon opinions or assumptions that Zacks Investment Management considers to be reasonable. Any investment inherently involves a high degree of risk, beyond any specific risks discussed herein.
The S&P 500 Index is a well-known, unmanaged index of the prices of 500 large-company common stocks, mainly blue-chip stocks, selected by Standard & Poor’s. The S&P 500 Index assumes reinvestment of dividends but does not reflect advisory fees. The volatility of the benchmark may be materially different from the individual performance obtained by a specific investor. An investor cannot invest directly in an index.
The Russell 1000 Growth Index is a well-known, unmanaged index of the prices of 1000 large-company growth common stocks selected by Russell. The Russell 1000 Growth Index assumes reinvestment of dividends but does not reflect advisory fees. An investor cannot invest directly in an index. The volatility of the benchmark may be materially different from the individual performance obtained by a specific investor.
Nasdaq Composite Index is the market capitalization-weighted index of over 3,300 common equities listed on the Nasdaq stock exchange. The types of securities in the index include American depositary receipts, common stocks, real estate investment trusts (REITs) and tracking stocks, as well as limited partnership interests. The index includes all Nasdaq-listed stocks that are not derivatives, preferred shares, funds, exchange-traded funds (ETFs) or debenture securities. An investor cannot invest directly in an index. The volatility of the benchmark may be materially different from the individual performance obtained by a specific investor.
The Dow Jones Industrial Average measures the daily stock market movements of 30 U.S. publicly-traded companies listed on the NASDAQ or the New York Stock Exchange (NYSE). The 30 publicly-owned companies are considered leaders in the United States economy. An investor cannot directly invest in an index. The volatility of the benchmark may be materially different from the individual performance obtained by a specific investor.
The Bloomberg Global Aggregate Index is a flagship measure of global investment grade debt from twenty-four local currency markets. This multi-currency benchmark includes treasury, government-related, corporate and securitized fixed-rate bonds from both developed and emerging markets issuers. An investor cannot invest directly in an index. The volatility of the benchmark may be materially different from the individual performance obtained by a specific investor.
The ICE Exchange-Listed Fixed & Adjustable Rate Preferred Securities Index is a modified market capitalization weighted index composed of preferred stock and securities that are functionally equivalent to preferred stock including, but not limited to, depositary preferred securities, perpetual subordinated debt and certain securities issued by banks and other financial institutions that are eligible for capital treatment with respect to such instruments akin to that received for issuance of straight preferred stock. An investor cannot invest directly in an index. The volatility of the benchmark may be materially different from the individual performance obtained by a specific investor.
The MSCI ACWI ex U.S. Index captures large and mid-cap representation across 22 of 23 Developed Markets (DM) countries (excluding the United States) and 24 Emerging Markets (EM) countries. The index covers approximately 85% of the global equity opportunity set outside the U.S. An investor cannot invest directly in an index. The volatility of the benchmark may be materially different from the individual performance obtained by a specific investor.
The Russell 2000 Index is a well-known, unmanaged index of the prices of 2000 small-cap company common stocks, selected by Russell. The Russell 2000 Index assumes reinvestment of dividends but does not reflect advisory fees. An investor cannot invest directly in an index. The volatility of the benchmark may be materially different from the individual performance obtained by a specific investor.
The S&P Mid Cap 400 provides investors with a benchmark for mid-sized companies. The index, which is distinct from the large-cap S&P 500, is designed to measure the performance of 400 mid-sized companies, reflecting the distinctive risk and return characteristics of this market segment.
The S&P 500 Pure Value index is a style-concentrated index designed to track the performance of stocks that exhibit the strongest value characteristics by using a style-attractiveness-weighting scheme. An investor cannot directly invest in an index. The volatility of the benchmark may be materially different from the individual performance obtained by a specific investor.