Will 2024 Mark the Return of a Negative Stock-Bond Correlation?
As nearly every investor knows, 2022 was a challenging year for equities. Inflation’s upside surprise caused the Federal Reserve to shift quickly from quantitative easing (QE) to quantitative tightening (QT), while aggressively raising the benchmark Fed funds rate from 0.1% to 4.4%.1 Stocks were pressured into a bear market, with the S&P 500 shedding -18.1% for the year.2
Normally investors would hope to mitigate some of the downside with a fixed income allocation. But that didn’t happen in 2022.
Instead, bond yields shot higher, as worse-than-expected inflation and the end of quantitative easing put upward pressure on the 10-year U.S. Treasury bond yield. The result was a big down year for the 10-year (-17.83%), with yields more than doubling from 1.6% to 3.88%. For the first time since 1958-1959, U.S. Treasury bonds (10-year) delivered two consecutive years of negative returns.
Rarely do we see across-the-board selloffs in fixed income coincide with a major stock market drawdown. This event gave investors a stark reminder: bonds are generally great hedges against growth shocks (recession-led bear markets), but they do not offer much cover during inflation shocks.
History reminds us as much.
If we look back at the late 1960s and 1970s, we can find another environment when stocks and bonds started moving in the same direction and an environment where inflation shocked to the upside. The 1973 oil embargo catalyzed already creeping inflation, and inflation expectations also started to drift higher. Positive correlation between stocks and bonds took hold.
It wasn’t until the late 1990s when a negative stock-bond correlation resurfaced, which was also the time when inflation expectations fell back down to more normal/neutral levels (slightly less than 3%). That negative correlation lasted for a little over 20 years, which meant that diversified stock-bond portfolios were largely effective at mitigating volatility and hedging against weak growth.
The two charts below illustrate how the relationship between inflation expectations and stock/bond correlation played out. In the first chart, readers can see that inflation expectations were elevated throughout the 1980s but gradually improved as consumers became more firmly convinced that inflation was in a sustained downtrend.
One- and Five-Year Expected Inflation
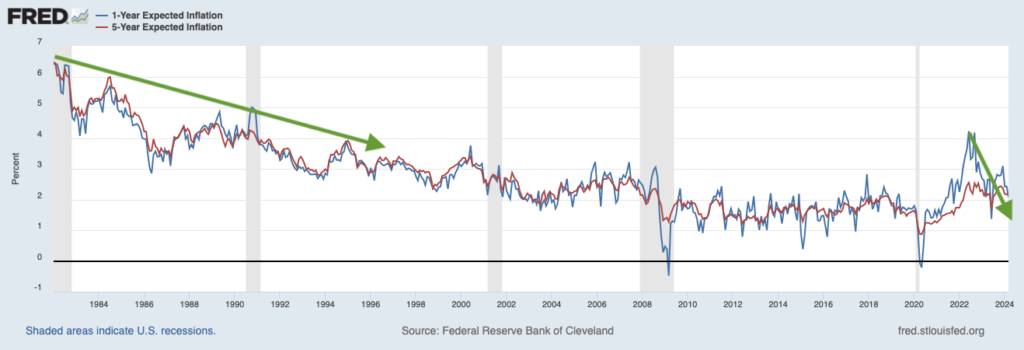
As inflation expectations become more anchored, the stock/bond correlation turned negative and stayed that way for over 20 years (chart below). We saw a positive correlation return when inflation and inflation expectations shot higher (2021 – 2022 in the chart above).
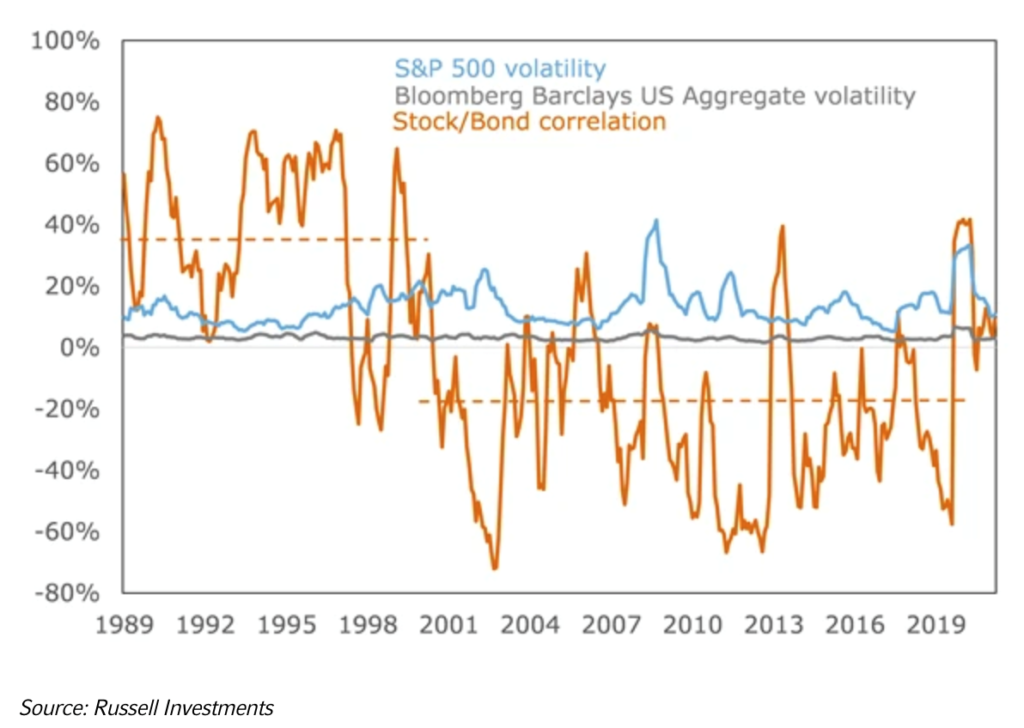
The good news today—and the reason I think a negative stock/bond correlation could return in 2024—is that inflation expectations have moved sharply lower from peaks, and could continue in a downtrend or at least hover below 3% for the year. But if inflation continues to moderate, history suggests that the stock-bond correlation could flip back to negative, much like we saw in the late 1990s.
Bottom Line for Investors
The return of negative stock-bond correlation would strengthen a ‘balanced’ portfolio’s ability to mitigate equity market volatility and also suggests that bonds would hold their own in a period of weak economic growth. I expect that 2024 will not feature weak growth, but a longer-term perspective looks favorable for a multi-asset, diversified portfolio—assuming such an allocation is appropriate relative to an investor’s goals and needs.
Disclosure
2 NYU. January 2024. https://pages.stern.nyu.edu/~adamodar/New_Home_Page/datafile/histretSP.html
3 Fred Economic Data. March 12, 2024. https://fred.stlouisfed.org/series/EXPINF1YR#
4 Russell Investments. 2024. https://russellinvestments.com/us/blog/is-the-stock-bond-correlation-positive-or-negative
DISCLOSURE
Past performance is no guarantee of future results. Inherent in any investment is the potential for loss.
Zacks Investment Management, Inc. is a wholly-owned subsidiary of Zacks Investment Research. Zacks Investment Management is an independent Registered Investment Advisory firm and acts as an investment manager for individuals and institutions. Zacks Investment Research is a provider of earnings data and other financial data to institutions and to individuals.
This material is being provided for informational purposes only and nothing herein constitutes investment, legal, accounting or tax advice, or a recommendation to buy, sell or hold a security. Do not act or rely upon the information and advice given in this publication without seeking the services of competent and professional legal, tax, or accounting counsel. Publication and distribution of this article is not intended to create, and the information contained herein does not constitute, an attorney-client relationship. No recommendation or advice is being given as to whether any investment or strategy is suitable for a particular investor. It should not be assumed that any investments in securities, companies, sectors or markets identified and described were or will be profitable. All information is current as of the date of herein and is subject to change without notice. Any views or opinions expressed may not reflect those of the firm as a whole.
Any projections, targets, or estimates in this report are forward looking statements and are based on the firm’s research, analysis, and assumptions. Due to rapidly changing market conditions and the complexity of investment decisions, supplemental information and other sources may be required to make informed investment decisions based on your individual investment objectives and suitability specifications. All expressions of opinions are subject to change without notice. Clients should seek financial advice regarding the appropriateness of investing in any security or investment strategy discussed in this presentation.
Certain economic and market information contained herein has been obtained from published sources prepared by other parties. Zacks Investment Management does not assume any responsibility for the accuracy or completeness of such information. Further, no third party has assumed responsibility for independently verifying the information contained herein and accordingly no such persons make any representations with respect to the accuracy, completeness or reasonableness of the information provided herein. Unless otherwise indicated, market analysis and conclusions are based upon opinions or assumptions that Zacks Investment Management considers to be reasonable. Any investment inherently involves a high degree of risk, beyond any specific risks discussed herein.
The S&P 500 Index is a well-known, unmanaged index of the prices of 500 large-company common stocks, mainly blue-chip stocks, selected by Standard & Poor’s. The S&P 500 Index assumes reinvestment of dividends but does not reflect advisory fees. The volatility of the benchmark may be materially different from the individual performance obtained by a specific investor. An investor cannot invest directly in an index.
The Russell 1000 Growth Index is a well-known, unmanaged index of the prices of 1000 large-company growth common stocks selected by Russell. The Russell 1000 Growth Index assumes reinvestment of dividends but does not reflect advisory fees. An investor cannot invest directly in an index. The volatility of the benchmark may be materially different from the individual performance obtained by a specific investor.
Nasdaq Composite Index is the market capitalization-weighted index of over 3,300 common equities listed on the Nasdaq stock exchange. The types of securities in the index include American depositary receipts, common stocks, real estate investment trusts (REITs) and tracking stocks, as well as limited partnership interests. The index includes all Nasdaq-listed stocks that are not derivatives, preferred shares, funds, exchange-traded funds (ETFs) or debenture securities. An investor cannot invest directly in an index. The volatility of the benchmark may be materially different from the individual performance obtained by a specific investor.
The Dow Jones Industrial Average measures the daily stock market movements of 30 U.S. publicly-traded companies listed on the NASDAQ or the New York Stock Exchange (NYSE). The 30 publicly-owned companies are considered leaders in the United States economy. An investor cannot directly invest in an index. The volatility of the benchmark may be materially different from the individual performance obtained by a specific investor.
The Bloomberg Global Aggregate Index is a flagship measure of global investment grade debt from twenty-four local currency markets. This multi-currency benchmark includes treasury, government-related, corporate and securitized fixed-rate bonds from both developed and emerging markets issuers. An investor cannot invest directly in an index. The volatility of the benchmark may be materially different from the individual performance obtained by a specific investor.
The ICE Exchange-Listed Fixed & Adjustable Rate Preferred Securities Index is a modified market capitalization weighted index composed of preferred stock and securities that are functionally equivalent to preferred stock including, but not limited to, depositary preferred securities, perpetual subordinated debt and certain securities issued by banks and other financial institutions that are eligible for capital treatment with respect to such instruments akin to that received for issuance of straight preferred stock. An investor cannot invest directly in an index. The volatility of the benchmark may be materially different from the individual performance obtained by a specific investor.
The MSCI ACWI ex U.S. Index captures large and mid-cap representation across 22 of 23 Developed Markets (DM) countries (excluding the United States) and 24 Emerging Markets (EM) countries. The index covers approximately 85% of the global equity opportunity set outside the U.S. An investor cannot invest directly in an index. The volatility of the benchmark may be materially different from the individual performance obtained by a specific investor.
The Russell 2000 Index is a well-known, unmanaged index of the prices of 2000 small-cap company common stocks, selected by Russell. The Russell 2000 Index assumes reinvestment of dividends but does not reflect advisory fees. An investor cannot invest directly in an index. The volatility of the benchmark may be materially different from the individual performance obtained by a specific investor.
The S&P Mid Cap 400 provides investors with a benchmark for mid-sized companies. The index, which is distinct from the large-cap S&P 500, is designed to measure the performance of 400 mid-sized companies, reflecting the distinctive risk and return characteristics of this market segment.
The S&P 500 Pure Value index is a style-concentrated index designed to track the performance of stocks that exhibit the strongest value characteristics by using a style-attractiveness-weighting scheme. An investor cannot directly invest in an index. The volatility of the benchmark may be materially different from the individual performance obtained by a specific investor.