The outlook for U.S. corporate earnings has weakened as bond yields have shot higher. Many investors are now wondering if the case for owning bonds is stronger than it is for stocks in the coming months, or maybe even years.
I illustrate this question below with two charts. The first is a look at the evolution of S&P 500 earnings-per-share estimates for 2023, and the second is a look at the 10-year and 30-year U.S. Treasury bond yields since 2020. Readers can see how the allure for stocks appears to be falling while bonds are paying significantly higher risk-free rates.1
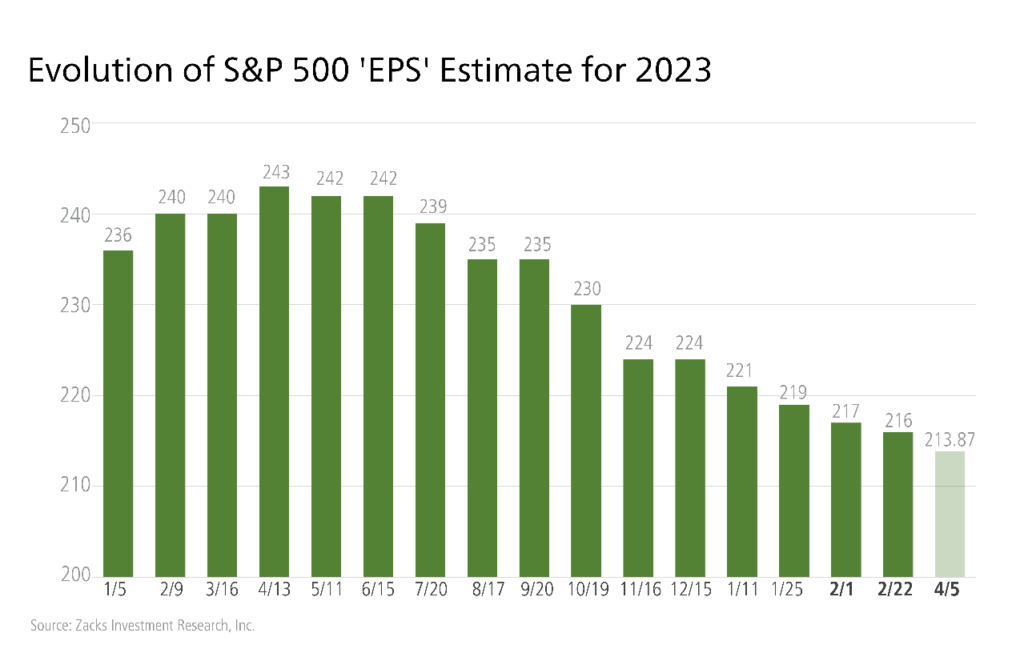
Zacks Investment Research2
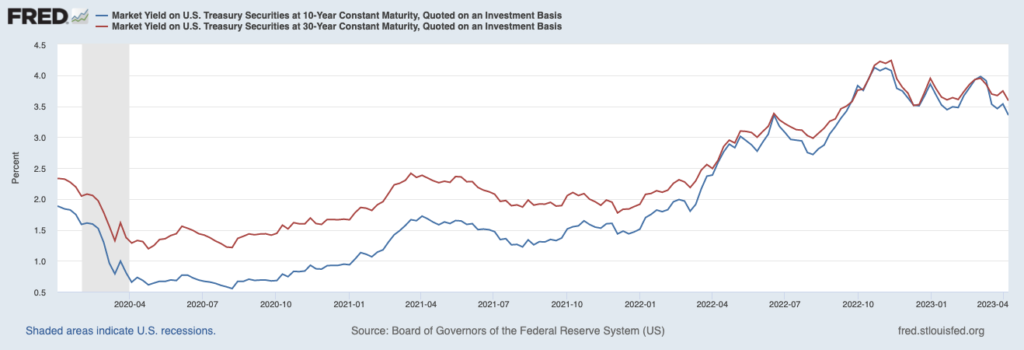
Source: Federal Reserve Bank of St. Louis3
In the investment world, comparing the earnings yield on stocks with the yield on U.S. Treasuries is how you measure the equity risk premium. This metric tells investors the excess return over the risk-free rate they can expect from investing in the stock market. The theory goes that the higher the equity risk premium, the stronger the case for stocks versus bonds.
As a quick refresher for readers who may not be familiar, a stock’s earnings yield is the inverse of its P/E ratio, meaning that it’s the ratio of last year’s profits to the current stock price (E/P). In my view, comparing the E/P to long-duration Treasury bond yields is somewhat of a flawed comparison from the get-go, since the earnings yield considers past profits, not future ones. I’m a firm believer that a stock’s future returns hinge on expected and realized profits in the next year or beyond, not what the company delivered last year.
Comparing the current E/P of the S&P 500 (~4.5%) to the current yield on the 10-year U.S. Treasury bond (~3.4%)4, reveals a relatively small equity risk premium – the lowest it’s been since October 2007 when stocks were trading at high valuations (a high ‘P’ value in the E/P ratio) and 10-year Treasury bond yields were around 4.5%. Comparing the current forward earnings yield on the S&P 500 (~5.5%) to the 10-year widens the gap to about 2%, which is still well below the average equity risk premium of 3.5% since 2008.
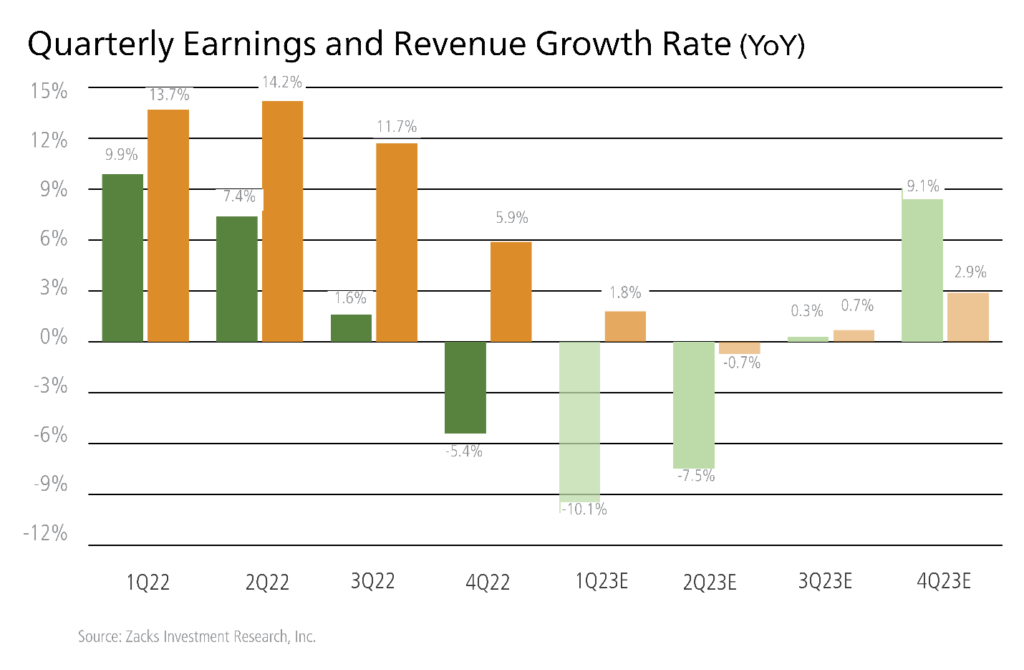
Stock investors may see this and wonder: shouldn’t a below-average equity risk premium warrant some caution and/or rebalancing? The financial media often frames it that way, but in reality, the average equity risk premium over the last 65 years is 1.62% – pretty much right in line with where the market is today. I’d also point out that our outlook throughout 2023 and into 2024 is for corporate earnings to recover (first chart below), while interest rates likely level off or even come down slightly (second chart, which shows median expectations for fed funds in the next three years). By our estimates, the equity risk premium has a better chance of rising over the course of the year than shrinking.
Zacks Investment Research5
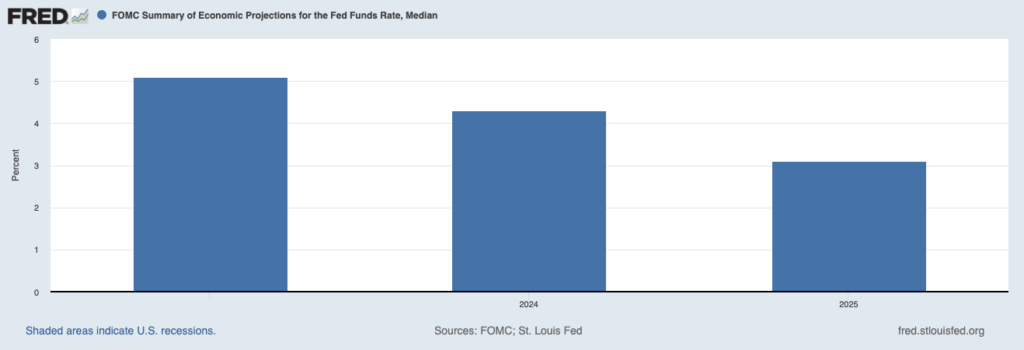
Source: Federal Reserve Bank of St. Louis6
Bottom Line for Investors
The equity risk premium is a useful metric that investors can use in evaluating the stock-bond decision, but it’s certainly not the only consideration, in my view. Investors should also think about where they expect interest rates and earnings to be a year from now, which is another way of assessing whether the equity risk premium is expected to rise or fall looking forward. From my vantage, I expect inflation to moderate, earnings to recover, and the Fed to pause interest rate increases – all of which bolster the case for equities even as Treasuries now offer a more attractive risk-free rate.
Disclosure
2 Zacks.com. April 5, 2023. https://www.zacks.com/commentary/2075142/bank-earnings-looming-what-can-investors-expect
3 Fred Economic Data. April 10, 2023. https://fred.stlouisfed.org/series/DGS10#
4 U.S. Department of the Treasury. 2023. https://home.treasury.gov/resource-center/data-chart-center/interest-rates/TextView?type=daily_treasury_yield_curve&field_tdr_date_value_month=202304
5 Zacks.com. April 5, 2023. https://www.zacks.com/commentary/2075142/bank-earnings-looming-what-can-investors-expect
6 Fred Economic Data. April 10, 2023. https://fred.stlouisfed.org/series/DGS10
DISCLOSURE
Past performance is no guarantee of future results. Inherent in any investment is the potential for loss.
Zacks Investment Management, Inc. is a wholly-owned subsidiary of Zacks Investment Research. Zacks Investment Management is an independent Registered Investment Advisory firm and acts as an investment manager for individuals and institutions. Zacks Investment Research is a provider of earnings data and other financial data to institutions and to individuals.
This material is being provided for informational purposes only and nothing herein constitutes investment, legal, accounting or tax advice, or a recommendation to buy, sell or hold a security. Do not act or rely upon the information and advice given in this publication without seeking the services of competent and professional legal, tax, or accounting counsel. Publication and distribution of this article is not intended to create, and the information contained herein does not constitute, an attorney-client relationship. No recommendation or advice is being given as to whether any investment or strategy is suitable for a particular investor. It should not be assumed that any investments in securities, companies, sectors or markets identified and described were or will be profitable. All information is current as of the date of herein and is subject to change without notice. Any views or opinions expressed may not reflect those of the firm as a whole.
Any projections, targets, or estimates in this report are forward looking statements and are based on the firm’s research, analysis, and assumptions. Due to rapidly changing market conditions and the complexity of investment decisions, supplemental information and other sources may be required to make informed investment decisions based on your individual investment objectives and suitability specifications. All expressions of opinions are subject to change without notice. Clients should seek financial advice regarding the appropriateness of investing in any security or investment strategy discussed in this presentation.
Certain economic and market information contained herein has been obtained from published sources prepared by other parties. Zacks Investment Management does not assume any responsibility for the accuracy or completeness of such information. Further, no third party has assumed responsibility for independently verifying the information contained herein and accordingly no such persons make any representations with respect to the accuracy, completeness or reasonableness of the information provided herein. Unless otherwise indicated, market analysis and conclusions are based upon opinions or assumptions that Zacks Investment Management considers to be reasonable. Any investment inherently involves a high degree of risk, beyond any specific risks discussed herein.
The S&P 500 Index is a well-known, unmanaged index of the prices of 500 large-company common stocks, mainly blue-chip stocks, selected by Standard & Poor’s. The S&P 500 Index assumes reinvestment of dividends but does not reflect advisory fees. The volatility of the benchmark may be materially different from the individual performance obtained by a specific investor. An investor cannot invest directly in an index.
The Russell 1000 Growth Index is a well-known, unmanaged index of the prices of 1000 large-company growth common stocks selected by Russell. The Russell 1000 Growth Index assumes reinvestment of dividends but does not reflect advisory fees. An investor cannot invest directly in an index. The volatility of the benchmark may be materially different from the individual performance obtained by a specific investor.
Nasdaq Composite Index is the market capitalization-weighted index of over 3,300 common equities listed on the Nasdaq stock exchange. The types of securities in the index include American depositary receipts, common stocks, real estate investment trusts (REITs) and tracking stocks, as well as limited partnership interests. The index includes all Nasdaq-listed stocks that are not derivatives, preferred shares, funds, exchange-traded funds (ETFs) or debenture securities. An investor cannot invest directly in an index. The volatility of the benchmark may be materially different from the individual performance obtained by a specific investor.
The Dow Jones Industrial Average measures the daily stock market movements of 30 U.S. publicly-traded companies listed on the NASDAQ or the New York Stock Exchange (NYSE). The 30 publicly-owned companies are considered leaders in the United States economy. An investor cannot directly invest in an index. The volatility of the benchmark may be materially different from the individual performance obtained by a specific investor.
The Bloomberg Global Aggregate Index is a flagship measure of global investment grade debt from twenty-four local currency markets. This multi-currency benchmark includes treasury, government-related, corporate and securitized fixed-rate bonds from both developed and emerging markets issuers. An investor cannot invest directly in an index. The volatility of the benchmark may be materially different from the individual performance obtained by a specific investor.
The ICE Exchange-Listed Fixed & Adjustable Rate Preferred Securities Index is a modified market capitalization weighted index composed of preferred stock and securities that are functionally equivalent to preferred stock including, but not limited to, depositary preferred securities, perpetual subordinated debt and certain securities issued by banks and other financial institutions that are eligible for capital treatment with respect to such instruments akin to that received for issuance of straight preferred stock. An investor cannot invest directly in an index. The volatility of the benchmark may be materially different from the individual performance obtained by a specific investor.
The MSCI ACWI ex U.S. Index captures large and mid-cap representation across 22 of 23 Developed Markets (DM) countries (excluding the United States) and 24 Emerging Markets (EM) countries. The index covers approximately 85% of the global equity opportunity set outside the U.S. An investor cannot invest directly in an index. The volatility of the benchmark may be materially different from the individual performance obtained by a specific investor.