Economists have become more skeptical about inflation in 2023.
According to the Wall Street Journal’s latest survey of economists, the average expectation is for inflation (as measured by the consumer price index) to hit 3.53% year-over-year by December. Just three months ago, the average expectation was for a 3.1% y-o-y CPI increase.
Long-time readers of my column know I do not generally put much weight in consensus expectations from an economic perspective. But I do think they’re useful for gauging sentiment, which from an investment perspective helps set the table for a positive or negative surprise. In the current environment, just about everyone expects a recession in 2023, and expectations for inflation are now going up.1
I see that as a good thing for markets. Why? Because now I think it’s even more possible that inflation and growth surprise to the upside this year.
Earlier in April, the Labor Department released CPI data confirming that inflation remains in a downtrend. CPI registered at 5% year-over-year in March, down from February’s 6% year-over-year increase and marking the smallest increase since May 2021. Services prices remain elevated, but a close look at the data reveals that much of the pressure is coming from the shelter component, which makes up one-third of CPI.
It’s important to note that shelter prices impact CPI with a significant lag. Since shelter prices measure what renters and homeowners pay for housing by including new and existing leases, it means that any meaningful declines would not show up in the CPI numbers for months. We’re showing that new leases have come down sharply in price, with an index of new leases declining at a 3-month annualized rate of slightly less than 3%. By my estimations, the shelter component should contribute significantly less to inflation starting in June and extending into the fall.
Two other key data points are bolstering the case for a better-than-expected inflation outcome this year. The first is M2 money supply declining by $130 billion in February and -2.4% year-over-year, which marks the fastest rate of decline in M2 since the 1930s (chart on the next page). Changes to the consumer price index tend to lag M2 money growth by about a year or so, which suggests we could see a significant anchoring effect on inflation in the coming quarters.
M2 Money Supply – Percent Change from a Year Ago
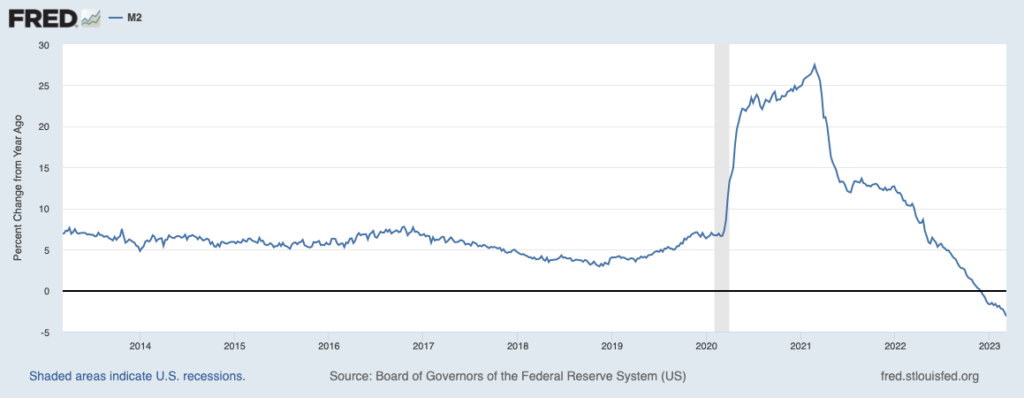
Source: Federal Reserve Bank of St. Louis2
The second data point worth referencing is the number of job openings in the U.S., which in February fell to 9.9 million from January’s 10.6 million. This figure is down considerably from the peak of 12 million job openings reached in March 2022 and signals that rate hikes are easing labor market pressures – particularly wage pressures – without triggering mass layoffs (at least not yet). Private data from companies like ZipRecruiter and Indeed suggest that job openings may even be declining at a faster pace than government data suggests, and the impact on average hourly earnings appears to be taking hold:
Average Hourly Earnings Growth May Have Peaked in March 2022
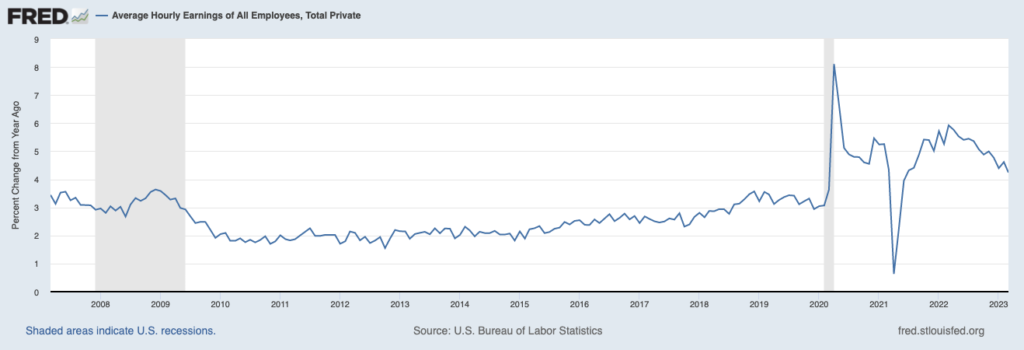
Source: Federal Reserve Bank of St. Louis3
Bottom Line for Investors
This column has focused on the consumer price index (CPI), but it’s worth noting that CPI is not the Federal Reserve’s preferred inflation indicator for setting monetary policy. They prefer the personal consumption expenditures (PCE) price index, which rose 5% year over year in February, and is expected to have ticked lower in March. Mark your calendars: the March release for the PCE price index is on April 28.
The reason the inflation question matters so much, of course, is because inflation data sets the stage for interest rate policy. As of today, the Federal Reserve is forecasting only one more 25 basis point rate hike in this tightening cycle, which hinges on inflation continuing in a downtrend. In my view, the table is set for inflation to continue falling – barring another commodity market shock or some other extraneous factor – and for interest rates to hit a peak, likely this summer.
Disclosure
2 Fred Economic Data. March 8, 2023. https://fred.stlouisfed.org/series/WM2NS#
3 Fred Economic Data. March 2023. https://fred.stlouisfed.org/series/CES0500000003#
DISCLOSURE
Past performance is no guarantee of future results. Inherent in any investment is the potential for loss.
Zacks Investment Management, Inc. is a wholly-owned subsidiary of Zacks Investment Research. Zacks Investment Management is an independent Registered Investment Advisory firm and acts as an investment manager for individuals and institutions. Zacks Investment Research is a provider of earnings data and other financial data to institutions and to individuals.
This material is being provided for informational purposes only and nothing herein constitutes investment, legal, accounting or tax advice, or a recommendation to buy, sell or hold a security. Do not act or rely upon the information and advice given in this publication without seeking the services of competent and professional legal, tax, or accounting counsel. Publication and distribution of this article is not intended to create, and the information contained herein does not constitute, an attorney-client relationship. No recommendation or advice is being given as to whether any investment or strategy is suitable for a particular investor. It should not be assumed that any investments in securities, companies, sectors or markets identified and described were or will be profitable. All information is current as of the date of herein and is subject to change without notice. Any views or opinions expressed may not reflect those of the firm as a whole.
Any projections, targets, or estimates in this report are forward looking statements and are based on the firm’s research, analysis, and assumptions. Due to rapidly changing market conditions and the complexity of investment decisions, supplemental information and other sources may be required to make informed investment decisions based on your individual investment objectives and suitability specifications. All expressions of opinions are subject to change without notice. Clients should seek financial advice regarding the appropriateness of investing in any security or investment strategy discussed in this presentation.
Certain economic and market information contained herein has been obtained from published sources prepared by other parties. Zacks Investment Management does not assume any responsibility for the accuracy or completeness of such information. Further, no third party has assumed responsibility for independently verifying the information contained herein and accordingly no such persons make any representations with respect to the accuracy, completeness or reasonableness of the information provided herein. Unless otherwise indicated, market analysis and conclusions are based upon opinions or assumptions that Zacks Investment Management considers to be reasonable. Any investment inherently involves a high degree of risk, beyond any specific risks discussed herein.
The S&P 500 Index is a well-known, unmanaged index of the prices of 500 large-company common stocks, mainly blue-chip stocks, selected by Standard & Poor’s. The S&P 500 Index assumes reinvestment of dividends but does not reflect advisory fees. The volatility of the benchmark may be materially different from the individual performance obtained by a specific investor. An investor cannot invest directly in an index.
The Russell 1000 Growth Index is a well-known, unmanaged index of the prices of 1000 large-company growth common stocks selected by Russell. The Russell 1000 Growth Index assumes reinvestment of dividends but does not reflect advisory fees. An investor cannot invest directly in an index. The volatility of the benchmark may be materially different from the individual performance obtained by a specific investor.
Nasdaq Composite Index is the market capitalization-weighted index of over 3,300 common equities listed on the Nasdaq stock exchange. The types of securities in the index include American depositary receipts, common stocks, real estate investment trusts (REITs) and tracking stocks, as well as limited partnership interests. The index includes all Nasdaq-listed stocks that are not derivatives, preferred shares, funds, exchange-traded funds (ETFs) or debenture securities. An investor cannot invest directly in an index. The volatility of the benchmark may be materially different from the individual performance obtained by a specific investor.
The Dow Jones Industrial Average measures the daily stock market movements of 30 U.S. publicly-traded companies listed on the NASDAQ or the New York Stock Exchange (NYSE). The 30 publicly-owned companies are considered leaders in the United States economy. An investor cannot directly invest in an index. The volatility of the benchmark may be materially different from the individual performance obtained by a specific investor.
The Bloomberg Global Aggregate Index is a flagship measure of global investment grade debt from twenty-four local currency markets. This multi-currency benchmark includes treasury, government-related, corporate and securitized fixed-rate bonds from both developed and emerging markets issuers. An investor cannot invest directly in an index. The volatility of the benchmark may be materially different from the individual performance obtained by a specific investor.
The ICE Exchange-Listed Fixed & Adjustable Rate Preferred Securities Index is a modified market capitalization weighted index composed of preferred stock and securities that are functionally equivalent to preferred stock including, but not limited to, depositary preferred securities, perpetual subordinated debt and certain securities issued by banks and other financial institutions that are eligible for capital treatment with respect to such instruments akin to that received for issuance of straight preferred stock. An investor cannot invest directly in an index. The volatility of the benchmark may be materially different from the individual performance obtained by a specific investor.
The MSCI ACWI ex U.S. Index captures large and mid-cap representation across 22 of 23 Developed Markets (DM) countries (excluding the United States) and 24 Emerging Markets (EM) countries. The index covers approximately 85% of the global equity opportunity set outside the U.S. An investor cannot invest directly in an index. The volatility of the benchmark may be materially different from the individual performance obtained by a specific investor.