What History Tells Us About an Economic ‘Soft Landing’
Will the U.S. economy avoid a recession in 2024, which by extension would deem the Federal Reserve’s rate hike campaign a success?
That’s what every investor wants to know.
Before I offer my take on these questions, I think it’s worthwhile to look back in history for past examples of Fed-engineered ‘soft landings,’ and also to assess how the equity markets responded. One could argue that the U.S. economy was heading for a soft landing in 2020 on the heels of interest rate hikes in 2019. The labor market was strong, and economic output was steady. But then the pandemic happened.1
The next historical example of a soft landing requires us to look back to the mid-1990s, which underscores another historical fact: soft landings aren’t all that common.
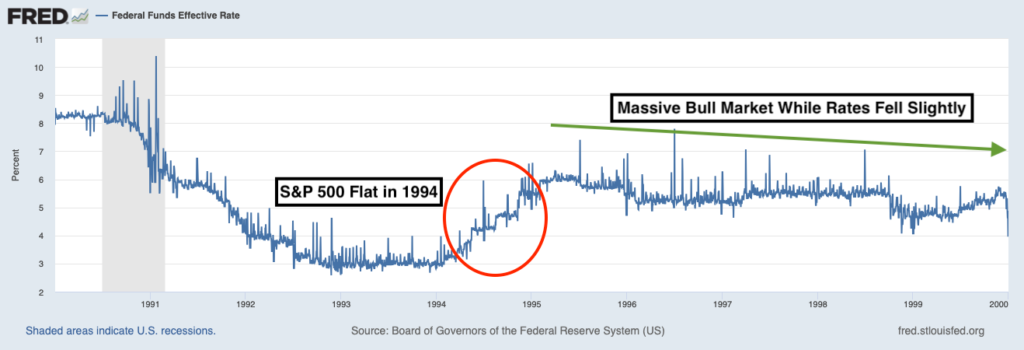
In 1994, Alan Greenspan’s Federal Reserve raised rates six times (adding a seventh hike in early 1995), as he was worried about an overheating economy driving inflation higher. Greenspan’s Fed doubled the benchmark Fed funds rate from 3.05% to 6.05% over that period, and the S&P 500 endured a volatile stretch in 1994. Stocks were up a paltry +1.33% that year (with dividends reinvested), while experiencing a -9% intra-year decline along the way.
Many readers likely remember what happened next, however. Greenspan’s Fed stopped raising rates in 1995 and even implemented some modest cuts (which, to note, is what we’re expecting in 2024). The economy and stock market did very well in the years that followed. U.S. GDP growth ‘bottomed out’ at 2.2% in Q4 1995, and the S&P 500 rallied +37.20% that year, +22.68% in 1996, +33.10% in 1997, +28.34% in 1998, and +20.89% in 1999.2
The chart below shows the benchmark Fed funds rate during the 1990s decade. Readers can see the period of rate hikes in 1994 that corresponded to a challenging year for stocks, and also the slightly falling – but largely steady – rates that followed for the remaining years of the decade.
Federal Funds Effective Rate, 1990 – 2000
In my view, the stock market’s rally late last year was a nod to the distinct possibility that the economy could keep growing modestly, but positively, in 2024 as the Federal Reserve positions for rate cuts – much like we saw in 1995. With inflation currently running at about 3% year-over-year, there’s not much justification to keep the fed funds rate at 5% to 5.25%. That feels overly restrictive, and the Fed has acknowledged as much.
Even though the Fed was raising rates last year, I think there’s a good comparison between 1995 and 2023. In both years, the economy continued growing despite rapidly rising rates, and the stock market posted strong returns in anticipation that rates would stop going up. The real question is, will 2024 look like 1996?
To be fair, soaring worker productivity in the dawn of the internet age was a key to the 1990s economic boom. The year-over-year change in labor productivity rose from 0.5% in Q1 1994 to 3.7% by Q1 1998, a massive leap. I’m not sure we’ll see a similar jump in the coming year(s), but I do think there are some supply-side factors working in the U.S. economy’s favor.
There has been massive investment in high-tech infrastructure and factories, and artificial intelligence could super-charge many companies’ ability to offer goods and services at scale with fewer workers.
Bottom Line for Investors
In 1996, real GDP growth was volatile from quarter to quarter but rose 2.5% for the year, and the S&P 500 climbed +22.68%. I won’t be so bold as to call for a similar outcome in 2024, but the idea of modest GDP growth with solid double-digit gains in stocks does not seem out of the realm of possibility.
In fact, I think it’s more likely than unlikely.
Disclosure
2 NYC. January 2023. https://pages.stern.nyu.edu/~adamodar/New_Home_Page/datafile/histretSP.html
3 Fred Economic Data. January 2, 2024. https://fred.stlouisfed.org/series/DFF#
DISCLOSURE
Past performance is no guarantee of future results. Inherent in any investment is the potential for loss.
Zacks Investment Management, Inc. is a wholly-owned subsidiary of Zacks Investment Research. Zacks Investment Management is an independent Registered Investment Advisory firm and acts as an investment manager for individuals and institutions. Zacks Investment Research is a provider of earnings data and other financial data to institutions and to individuals.
This material is being provided for informational purposes only and nothing herein constitutes investment, legal, accounting or tax advice, or a recommendation to buy, sell or hold a security. Do not act or rely upon the information and advice given in this publication without seeking the services of competent and professional legal, tax, or accounting counsel. Publication and distribution of this article is not intended to create, and the information contained herein does not constitute, an attorney-client relationship. No recommendation or advice is being given as to whether any investment or strategy is suitable for a particular investor. It should not be assumed that any investments in securities, companies, sectors or markets identified and described were or will be profitable. All information is current as of the date of herein and is subject to change without notice. Any views or opinions expressed may not reflect those of the firm as a whole.
Any projections, targets, or estimates in this report are forward looking statements and are based on the firm’s research, analysis, and assumptions. Due to rapidly changing market conditions and the complexity of investment decisions, supplemental information and other sources may be required to make informed investment decisions based on your individual investment objectives and suitability specifications. All expressions of opinions are subject to change without notice. Clients should seek financial advice regarding the appropriateness of investing in any security or investment strategy discussed in this presentation.
Certain economic and market information contained herein has been obtained from published sources prepared by other parties. Zacks Investment Management does not assume any responsibility for the accuracy or completeness of such information. Further, no third party has assumed responsibility for independently verifying the information contained herein and accordingly no such persons make any representations with respect to the accuracy, completeness or reasonableness of the information provided herein. Unless otherwise indicated, market analysis and conclusions are based upon opinions or assumptions that Zacks Investment Management considers to be reasonable. Any investment inherently involves a high degree of risk, beyond any specific risks discussed herein.
The S&P 500 Index is a well-known, unmanaged index of the prices of 500 large-company common stocks, mainly blue-chip stocks, selected by Standard & Poor’s. The S&P 500 Index assumes reinvestment of dividends but does not reflect advisory fees. The volatility of the benchmark may be materially different from the individual performance obtained by a specific investor. An investor cannot invest directly in an index.
The Russell 1000 Growth Index is a well-known, unmanaged index of the prices of 1000 large-company growth common stocks selected by Russell. The Russell 1000 Growth Index assumes reinvestment of dividends but does not reflect advisory fees. An investor cannot invest directly in an index. The volatility of the benchmark may be materially different from the individual performance obtained by a specific investor.
Nasdaq Composite Index is the market capitalization-weighted index of over 3,300 common equities listed on the Nasdaq stock exchange. The types of securities in the index include American depositary receipts, common stocks, real estate investment trusts (REITs) and tracking stocks, as well as limited partnership interests. The index includes all Nasdaq-listed stocks that are not derivatives, preferred shares, funds, exchange-traded funds (ETFs) or debenture securities. An investor cannot invest directly in an index. The volatility of the benchmark may be materially different from the individual performance obtained by a specific investor.
The Dow Jones Industrial Average measures the daily stock market movements of 30 U.S. publicly-traded companies listed on the NASDAQ or the New York Stock Exchange (NYSE). The 30 publicly-owned companies are considered leaders in the United States economy. An investor cannot directly invest in an index. The volatility of the benchmark may be materially different from the individual performance obtained by a specific investor.
The Bloomberg Global Aggregate Index is a flagship measure of global investment grade debt from twenty-four local currency markets. This multi-currency benchmark includes treasury, government-related, corporate and securitized fixed-rate bonds from both developed and emerging markets issuers. An investor cannot invest directly in an index. The volatility of the benchmark may be materially different from the individual performance obtained by a specific investor.
The ICE Exchange-Listed Fixed & Adjustable Rate Preferred Securities Index is a modified market capitalization weighted index composed of preferred stock and securities that are functionally equivalent to preferred stock including, but not limited to, depositary preferred securities, perpetual subordinated debt and certain securities issued by banks and other financial institutions that are eligible for capital treatment with respect to such instruments akin to that received for issuance of straight preferred stock. An investor cannot invest directly in an index. The volatility of the benchmark may be materially different from the individual performance obtained by a specific investor.
The MSCI ACWI ex U.S. Index captures large and mid-cap representation across 22 of 23 Developed Markets (DM) countries (excluding the United States) and 24 Emerging Markets (EM) countries. The index covers approximately 85% of the global equity opportunity set outside the U.S. An investor cannot invest directly in an index. The volatility of the benchmark may be materially different from the individual performance obtained by a specific investor.
The Russell 2000 Index is a well-known, unmanaged index of the prices of 2000 small-cap company common stocks, selected by Russell. The Russell 2000 Index assumes reinvestment of dividends but does not reflect advisory fees. An investor cannot invest directly in an index. The volatility of the benchmark may be materially different from the individual performance obtained by a specific investor.
The S&P Mid Cap 400 provides investors with a benchmark for mid-sized companies. The index, which is distinct from the large-cap S&P 500, is designed to measure the performance of 400 mid-sized companies, reflecting the distinctive risk and return characteristics of this market segment.
The S&P 500 Pure Value index is a style-concentrated index designed to track the performance of stocks that exhibit the strongest value characteristics by using a style-attractiveness-weighting scheme. An investor cannot directly invest in an index. The volatility of the benchmark may be materially different from the individual performance obtained by a specific investor.