This week’s market is shifting quickly, but the underlying data is what really matters. In this edition of Steady Investor, we break down what investors should be paying attention to right now:
- Markets rally despite ongoing war
- Consumer sentiment hits record low
- Housing slows amid supply constraints
Stocks Rally as the Market Looks Past the War – Despite an ongoing conflict that has disrupted one of the world’s most critical energy chokepoints, it appears that markets have started to move on. The Nasdaq surged double digits over a 10-session winning streak, its longest since 2021, while the S&P 500 crossed the 7,000 threshold to reach a new record. Oil prices, after spiking earlier in the conflict, have also pulled back meaningfully from their recent peaks.In our view, the rally has been driven by a return to fundamentals, namely stronger-than-expected earnings and continued resilience in the U.S. economy. Companies across sectors continue to point to steady consumer demand and ongoing borrowing, even in the face of higher energy costs. What may be most notable, however, is how quickly markets have moved past the uncertainty. Historically, equity markets tend to price in geopolitical shocks far earlier than the news cycle would suggest. Across several major conflicts, markets have typically bottomed within roughly the first 10% of a war’s duration. Even in World War II, which lasted six years, stocks reached their low just months after fighting began. The pattern reflects how quickly markets adjust to new information, even when the ultimate outcome remains unclear.None of this suggests risks have disappeared. A prolonged conflict or renewed spike in oil prices could still pressure growth and inflation. But for now, markets appear focused less on today’s disruption and more on the path forward, one where earnings, liquidity, and economic momentum continue to provide support.1
Shifting Market Drivers Are Reshaping Performance – Here’s How
Markets haven’t lost momentum, but they’ve become more selective. Interest rates and earnings are shifting, and different stocks are leading the way.
Our latest April Stock Market Outlook Report5 takes a closer look at what’s changing beneath the surface, and how investors can make sense of it. Inside, you’ll learn:
- Asset allocation guidelines for today’s market environment
- Expert forecasts for inflation, rates, and economic trends
- Industry tables and rankings to help you spot opportunities
- Buy-side and sell-side consensus insights at a glance
- And much more!
If you have $500,000 or more to invest, claim your complimentary copy of the report and see how shifting market trends could influence opportunities in the months ahead.
IT’S FREE. Download our latest April Stock Market Outlook Report3
Consumer Sentiment Plummets. Is that a Good Thing for Markets? The University of Michigan Consumer Sentiment Index fell to 47.6 in April, which is its lowest reading in the survey’s 74-year history. Not during the 2008 Global Financial Crisis, the early days of COVID, or even the stagflation of the 1970s did sentiment fall this far. The prior low, set in June 2022, was 50. This month’s reading broke through that floor decisively, as seen in the chart below:
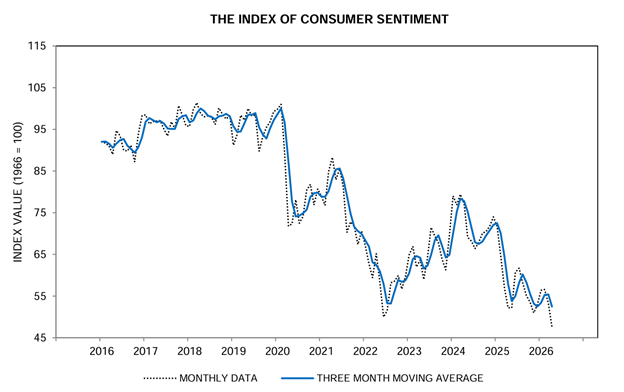
The drivers are straightforward. Gasoline prices surged 21% in a single month amid escalating tensions tied to the Iran conflict, pushing one-year inflation expectations from 3.8% to 4.8%—the largest monthly jump in a year. Consumers reported weaker personal finances and deteriorating buying conditions for big-ticket items like cars and durable goods. Historically, however, extreme pessimism hasn’t been a reliable warning sign for markets. In fact, it’s often the opposite. Research shows that the S&P 500 has returned an average of roughly 25% in the 12 months following sentiment troughs. That’s because sentiment tends to follow markets, not lead them. When expectations are already depressed, it lowers the bar for positive surprises.
A Sluggish Housing Market Meets a Persistent Supply Problem – The U.S. housing market is entering what is usually its busiest season on weak footing. Existing home sales fell 3.6% in March to an annualized pace of 3.98 million, one of the sharpest monthly declines in the past year. Higher mortgage rates, which climbed back above 6.3% following the onset of the Iran conflict, have only added to longstanding affordability pressures, leaving many prospective buyers either priced out or unwilling to commit. This dynamic is being reinforced by the supply side. Although inventory of existing homes has increased modestly, it remains historically low, helping lift the median home price 1.4% from a year earlier to $408,800. At the same time, many current homeowners remain reluctant to sell, since doing so would likely mean giving up a lower locked-in mortgage rate and taking on much higher borrowing costs for their next home. Builders are trying to fill some of that gap, but not without compromise. In an effort to preserve affordability, many are shrinking floor plans, simplifying designs, and opting for lower-cost materials. For the broader economy, however, the approach matters less than the outcome. Residential investment feeds into GDP mainly through new construction rather than existing home sales, so if tight inventory and elevated prices encourage even a modest increase in building activity, the housing market’s weakness could still end up providing a small tailwind to growth.4
What’s Driving the Market Right Now – As market conditions evolve, understanding what’s changing can make all the difference.
Our latest April Stock Market Outlook Report5 highlights the key trends investors should be watching, and how to think about them. You’ll get insights into:
- Asset allocation guidelines for today’s market environment
- Expert forecasts for inflation, rates, and economic trends
- Industry tables and rankings to help you spot opportunities
- Buy-side and sell-side consensus insights at a glance
- And much more!
If you have $500,000 or more to invest, claim your complimentary copy of the report and see how shifting market trends could influence opportunities in the months ahead.
Disclosure
2 Zacks Investment Management reserves the right to amend the terms or rescind the free-Stock Market Outlook Report offer at any time and for any reason at its discretion.
3 Survey of Consumers. 2026. https://www.sca.isr.umich.edu/charts.html
4 Wall Street Journal. April 13, 2026. https://www.wsj.com/real-estate/flimsier-cabinets-and-fewer-windows-home-builders-are-skimping-on-the-basics-59191680?mod=djem10point
5 Zacks Investment Management reserves the right to amend the terms or rescind the free-Stock Market Outlook Report offer at any time and for any reason at its discretion.
DISCLOSURE
Past performance is no guarantee of future results. Inherent in any investment is the potential for loss.
Zacks Investment Management, Inc. is a wholly-owned subsidiary of Zacks Investment Research. Zacks Investment Management is an independent Registered Investment Advisory firm and acts as an investment manager for individuals and institutions. Zacks Investment Research is a provider of earnings data and other financial data to institutions and to individuals.
This material is being provided for informational purposes only and nothing herein constitutes investment, legal, accounting or tax advice, or a recommendation to buy, sell or hold a security. Do not act or rely upon the information and advice given in this publication without seeking the services of competent and professional legal, tax, or accounting counsel. Publication and distribution of this article is not intended to create, and the information contained herein does not constitute, an attorney-client relationship. No recommendation or advice is being given as to whether any investment or strategy is suitable for a particular investor. It should not be assumed that any investments in securities, companies, sectors or markets identified and described were or will be profitable. All information is current as of the date of herein and is subject to change without notice. Any views or opinions expressed may not reflect those of the firm as a whole.
Any projections, targets, or estimates in this report are forward looking statements and are based on the firm’s research, analysis, and assumptions. Due to rapidly changing market conditions and the complexity of investment decisions, supplemental information and other sources may be required to make informed investment decisions based on your individual investment objectives and suitability specifications. All expressions of opinions are subject to change without notice. Clients should seek financial advice regarding the appropriateness of investing in any security or investment strategy discussed in this presentation.
Certain economic and market information contained herein has been obtained from published sources prepared by other parties. Zacks Investment Management does not assume any responsibility for the accuracy or completeness of such information. Further, no third party has assumed responsibility for independently verifying the information contained herein and accordingly no such persons make any representations with respect to the accuracy, completeness or reasonableness of the information provided herein. Unless otherwise indicated, market analysis and conclusions are based upon opinions or assumptions that Zacks Investment Management considers to be reasonable. Any investment inherently involves a high degree of risk, beyond any specific risks discussed herein.
The S&P 500 Index is a well-known, unmanaged index of the prices of 500 large-company common stocks, mainly blue-chip stocks, selected by Standard & Poor’s. The S&P 500 Index assumes reinvestment of dividends but does not reflect advisory fees. The volatility of the benchmark may be materially different from the individual performance obtained by a specific investor. An investor cannot invest directly in an index.
The Russell 2000 Index is a well-known, unmanaged index of the prices of 2000 small-cap company common stocks, selected by Russell. The Russell 2000 Index assumes reinvestment of dividends but does not reflect advisory fees. An investor cannot invest directly in an index. The volatility of the benchmark may be materially different from the individual performance obtained by a specific investor.
The Nasdaq Composite Index measures all Nasdaq domestic and international based common type stocks listed on The Nasdaq Stock Market. To be eligible for inclusion in the Index, the security's U.S. listing must be exclusively on The Nasdaq Stock Market (unless the security was dually listed on another U.S. market prior to January 1, 2004 and has continuously maintained such listing). The security types eligible for the Index include common stocks, ordinary shares, ADRs, shares of beneficial interest or limited partnership interests and tracking stocks. Security types not included in the Index are closed-end funds, convertible debentures, exchange traded funds, preferred stocks, rights, warrants, units and other derivative securities. An investor cannot invest directly in an index.