Are Record Diesel Prices Putting the Economy at Risk?
With so much attention focused on crude oil and gasoline prices, the financial media—and by extension, many investors—may be overlooking another energy cost with even broader economic reach: diesel prices.1
We don’t hear much about diesel prices when we talk about markets, inflation, and the economy, mostly because U.S. households rarely buy it directly. But we all still depend on diesel throughout the day, across many touchpoints. Diesel powers trucks delivering groceries, trains carrying freight, and much of the equipment used in farming and construction. According to preliminary Energy Information Administration data, the U.S. transportation sector consumed about 123 million gallons of petroleum diesel daily in 2025, representing roughly 22% of its energy use.2
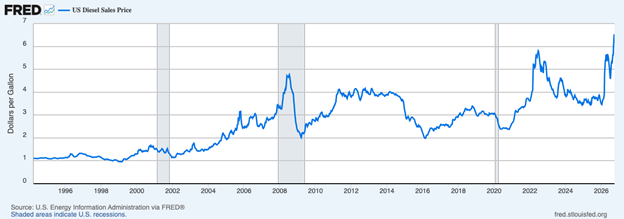
It follows that the cost of diesel reaches businesses and households well beyond the filling station. That means when the national average for diesel reaches a record $6.53 per gallon, as it did on September 22, we should all pay some attention.
U.S. Diesel Sales Price
Stay Ahead of Inflation Pressures with Our Latest Market Outlook
Diesel powers much of the economy, from freight transportation to farming and construction.
Rising prices could put pressure on business costs and inflation, with implications for investors.
Our latest Stock Market Outlook Report4 provides perspective on inflation, economic trends, and market conditions to help you assess what these pressures could mean for your portfolio.
Inside, you’ll learn:
- Asset allocation guidelines for today’s market environment
- Expert forecasts for inflation, rates, and economic trends
- Industry tables and rankings to help you spot opportunities
- Buy-side and sell-side consensus insights at a glance
- And much more!
Claim your complimentary copy of the report to learn how energy costs and changing economic conditions could affect your portfolio in the months ahead.
IT’S FREE. Download our Stock Market Outlook Report4
Consider a farmer encountering higher fuel costs while harvesting crops, followed by a higher freight bill to get those crops to market. Or a retailer facing additional delivery expenses across thousands of shipments, and what that means for margins. All told, if higher costs persist, businesses face difficult choices about pricing, profit margins, and how much activity they can sustain.
So far, the inflation data offer some reassurance. The Consumer Price Index excluding energy slowed from 2.9% year-over-year in May to 2.5% in August. This measure still includes food, making it particularly relevant to concerns about agricultural and transportation costs. By comparison, conventional core CPI, which excludes both food and energy, rose 2.4% in August. I want to be fair in disclosing that August’s inflation report predates the latest diesel-price surge, so in my view, September data will really tell us if pressures are legitimately mounting. Keep an eye on that report.
There is also evidence that the economy is absorbing higher costs reasonably well. Producer prices were up 5.4% year-over-year in August, compared with a 3.4% increase in consumer prices. That gap suggests many businesses are absorbing at least some of the increase through margins rather than passing every additional dollar of cost directly to customers.
History also offers some perspective. Diesel prices reached similarly elevated levels in 2022 without tipping the economy into recession, and today’s prices remain below earlier peaks after adjusting for inflation. I would not take that history as a guarantee that today’s increase is harmless, but it does argue against treating $6-plus diesel as an automatic economic breaking point.
There has been some discussion in Washington about restricting U.S. diesel exports as a way to keep more supply at home. I understand the appeal, but the economics don’t really add up, in my view. The U.S. currently produces more diesel than it consumes, and refiners rely on overseas markets for that excess production. If exports were sharply restricted, refiners could eventually respond by processing less crude. If refiners respond by reducing refinery runs, that could also tighten gasoline and jet fuel supplies, since those products are made alongside diesel. That falls in the category of “unintended consequences.”
Policymakers may not need to take such drastic action. As I write, it’s been reported that oil exports from the Persian Gulf increased substantially in September, with an estimated 10 million barrels per day moved through the Strait of Hormuz (up from 5.9 million in August). Another 6 million barrels per day left the region through pipelines and ports that bypass the strait.
Combined, that puts exports at roughly 16 million barrels per day, compared with around 19 million before the war—about 85% of the prewar level. More crude reaching global markets gives refiners more supply to work with and could gradually relieve some of the pressure that has pushed diesel prices higher.
Bottom Line for Investors
What I would watch from here is persistence. If diesel stays near record levels for months and we begin seeing higher transportation costs show up in broader inflation, weaker margins, or softer economic activity, my concern would go up.
At the same time, September’s improvement in Gulf oil flows is a reminder that supply conditions can change quickly. In my view, the key is to avoid getting too far ahead of the data. Diesel prices are a legitimate pressure point, but the improving supply picture gives us reason to see how the next few months unfold before assuming a broader economic impact.
Are rising energy costs a warning sign, or just one piece of the market picture? Get insights to help you assess the risks and spot opportunities in our latest Stock Market Outlook Report⁵.
Inside, you’ll learn:
- Asset allocation guidelines for today’s market environment
- Expert forecasts for inflation, rates, and economic trends
- Industry tables and rankings to help you spot opportunities
- Buy-side and sell-side consensus insights at a glance
- And much more!
Claim your complimentary copy of the report to learn how energy costs and changing economic conditions could affect your portfolio in the months ahead.
IT’S FREE. Download our Stock Market Outlook Report5
Disclosure
2 New York Times. September 29, 2026. “Oil Exports Strait of Hormuz.”
3 FRED, Fred Economic Data. September 29, 2026. “US Diesel Sales Price (GASDESW).”
4 Zacks Investment Management reserves the right to amend the terms or rescind the free Stock Market Outlook Report offer at any time and for any reason at its discretion.
5 Zacks Investment Management reserves the right to amend the terms or rescind the free Stock Market Outlook Report offer at any time and for any reason at its discretion.
DISCLOSURE
Past performance is no guarantee of future results. Inherent in any investment is the potential for loss.
Zacks Investment Management, Inc. is a wholly-owned subsidiary of Zacks Investment Research. Zacks Investment Management is an independent Registered Investment Advisory firm and acts as an investment manager for individuals and institutions. Zacks Investment Research is a provider of earnings data and other financial data to institutions and to individuals.
This material is being provided for informational purposes only and nothing herein constitutes investment, legal, accounting or tax advice, or a recommendation to buy, sell or hold a security. Do not act or rely upon the information and advice given in this publication without seeking the services of competent and professional legal, tax, or accounting counsel. Publication and distribution of this article is not intended to create, and the information contained herein does not constitute, an attorney-client relationship. No recommendation or advice is being given as to whether any investment or strategy is suitable for a particular investor. It should not be assumed that any investments in securities, companies, sectors or markets identified and described were or will be profitable. All information is current as of the date of herein and is subject to change without notice. Any views or opinions expressed may not reflect those of the firm as a whole.
Any projections, targets, or estimates in this report are forward looking statements and are based on the firm’s research, analysis, and assumptions. Due to rapidly changing market conditions and the complexity of investment decisions, supplemental information and other sources may be required to make informed investment decisions based on your individual investment objectives and suitability specifications. All expressions of opinions are subject to change without notice. Clients should seek financial advice regarding the appropriateness of investing in any security or investment strategy discussed in this presentation.
Certain economic and market information contained herein has been obtained from published sources prepared by other parties. Zacks Investment Management does not assume any responsibility for the accuracy or completeness of such information. Further, no third party has assumed responsibility for independently verifying the information contained herein and accordingly no such persons make any representations with respect to the accuracy, completeness or reasonableness of the information provided herein. Unless otherwise indicated, market analysis and conclusions are based upon opinions or assumptions that Zacks Investment Management considers to be reasonable. Any investment inherently involves a high degree of risk, beyond any specific risks discussed herein.
The S&P 500 Index is a well-known, unmanaged index of the prices of 500 large-company common stocks, mainly blue-chip stocks, selected by Standard & Poor’s. The S&P 500 Index assumes reinvestment of dividends but does not reflect advisory fees. The volatility of the benchmark may be materially different from the individual performance obtained by a specific investor. An investor cannot invest directly in an index.
The Russell 2000 Index is a well-known, unmanaged index of the prices of 2000 small-cap company common stocks, selected by Russell. The Russell 2000 Index assumes reinvestment of dividends but does not reflect advisory fees. An investor cannot invest directly in an index. The volatility of the benchmark may be materially different from the individual performance obtained by a specific investor.
The Nasdaq Composite Index measures all Nasdaq domestic and international based common type stocks listed on The Nasdaq Stock Market. To be eligible for inclusion in the Index, the security's U.S. listing must be exclusively on The Nasdaq Stock Market (unless the security was dually listed on another U.S. market prior to January 1, 2004 and has continuously maintained such listing). The security types eligible for the Index include common stocks, ordinary shares, ADRs, shares of beneficial interest or limited partnership interests and tracking stocks. Security types not included in the Index are closed-end funds, convertible debentures, exchange traded funds, preferred stocks, rights, warrants, units and other derivative securities. An investor cannot invest directly in an index.