The Schiller Cyclically Adjusted P/E (CAPE) Ratio hit 28 in recent days, which according to some news outlets “looks terrifying right now” and signals that the stock market may be “dangerously expensive.” Is it time for investors to ditch stocks and run for cover?
There’s a reason the alarm bells are sounding – on two previous occasions when the CAPE Ratio touched this level or higher, the market flipped over into a bear market. The ratio was near this level in 2007 just before the financial crisis. Additionally, it was just above its current level in 2000 before the tech bust and in 1929 leading into the Great Depression. It doesn’t take a sophisticated analysis to see that the CAPE Ratio at this level has been a dangerous precedent in the past. Many are urging investors to exercise extreme caution in portfolios.
Understanding the CAPE Ratio (And Its Limitations)
Before you go liquidating stocks in your portfolio, let’s take a moment to understand the origins and makeup of the CAPE Ratio – which will also help you understand if this is really a time to sell. A good starting point for understanding the CAPE ratio is to think about the basic P/E ratio (price to earnings) first. The P/E ratio measures a stock’s price relative to its per-share earnings over the last year. It is a widely accepted metric for measuring valuations, but Robert Shiller and fellow economist John Y. Campbell (now at Harvard) saw a problem with it.
They recognized that a company’s earnings can be fairly volatile from year to year, and that this is especially true during peak and trough years in a business cycle. So, to minimize the effect of business cycle gyrations on the valuation measure, the two economists created a ratio where the stock price is divided by the company’s average earnings over the previous 10 years, instead of just a single year. This helps “smooth” out the number and allows for comparing valuations over longer time horizons.
The CAPE calculation makes sense at face value, but there are several limitations to the calculations. For one, the past 10-years include the Great Recession and the Energy sector earnings recession, both of which hamstring the earnings averages considerably (since earnings are in the denominator of P/E, lower earnings mean higher ratios).
But perhaps the biggest – and least discussed – factor affecting CAPE ratios today are accounting rule changes that have pushed recent earnings lower. According to Wharton professor Jeremy Siegel, there have been countless revisions to the generally accepted accounting principles (GAAP) that Schiller uses, and that these changes have lowered GAAP earnings even though there were no changes to the underlying business of the corporation. It’d be like a company undergoing a 2-for-1 stock split and being treated like it was valued differently after the split, even though its market value doesn’t change whatsoever. Because these accounting changes have lowered GAAP earnings, the CAPE ratio has risen – but not because prices are too high relative to earnings.
Don’t Fear the CAPE – It’s Been This High Before, and Stocks Have Done Fine
In August of 2014, the CAPE once again flashed red, but nothing bad happened. In an August 16, 2014 New York Times op-ed, Shiller himself wrote that “the United States stock market looks very expensive right now. The CAPE [cyclically adjusted price-earnings] ratio, a stock-price measure I helped develop – is hovering at a worrisome level.” Well, guess what – the S&P 500 is up over 15% since Schiller wrote those words, and our outlook remains that stocks can move higher from here on additional economic growth and mid- to high-single digit earnings growth this year.
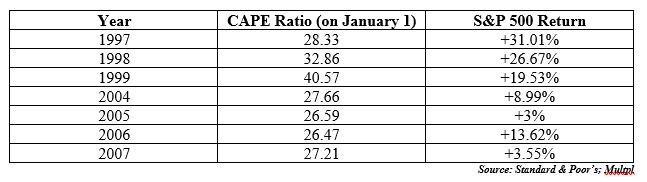
Scrutinizing the CAPE ratio against historical returns for the S&P 500 reveals more weaknesses with the ratio. The data in the table below demonstrates how the market can do quite well even when CAPE ratios exceed 25:
Bottom Line for Investors
Even Shiller agrees that the CAPE ratio shouldn’t be used as an actual market-timing tool. Rather, he thinks investors should use the CAPE ratios to trim positions that exhibit especially high ratios. Ok, fine.
The bottom line for investors is that a single metric such as the CAPE ratio should not be relied upon to make sweeping investment decisions or forecasts. Stocks are much more complicated than that, and they move on a myriad of factors at any given time. The keys, in our view, are focusing on leading economic indicators, economic growth expectations, forward earnings, the yield curve, the regulatory environment, amongst others. In other words, there are several factors to consider when assessing what stocks may do in the quarters ahead – not just a single factor like the CAPE ratio.
So just how does Zacks Investment Management view the economy right now? I invite you to download our Stock Market Outlook free of charge. Click the link below to download your copy today:
Disclosure
Zacks Investment Management, Inc. is a wholly-owned subsidiary of Zacks Investment Research. Zacks Investment Management is an independent Registered Investment Advisory firm and acts an investment manager for individuals and institutions. Zacks Investment Research is a provider of earnings data and other financial data to institutions and to individuals.
This material is being provided for informational purposes only and nothing herein constitutes investment, legal, accounting or tax advice, or a recommendation to buy, sell or hold a security. Do not act or rely upon the information and advice given in this publication without seeking the services of competent and professional legal, tax, or accounting counsel. The information contained herein has been obtained from sources believed to be reliable but we do not guarantee accuracy or completeness. Publication and distribution of this article is not intended to create, and the information contained herein does not constitute, an attorney-client relationship. No recommendation or advice is being given as to whether any investment or strategy is suitable for a particular investor. It should not be assumed that any investments in securities, companies, sectors or markets identified and described were or will be profitable. All information is current as of the date of herein and is subject to change without notice. Any views or opinions expressed may not reflect those of the firm as a whole.