Could the U.S. Government Soon Be Paying $1 Trillion…In Interest?
Ballooning U.S. debt and deficit spending has been a major headline over the last few months. The coverage has been warranted. According to the Congressional Budget Office, the gap between spending and revenue was $1.7 trillion in fiscal year 2023, which means the deficit grew by $300 billion year-over-year—even as the economy was expanding.1
One particular data point made some waves last week. A Bloomberg analysis indicated that estimated annualized interest payments – made by the U.S. government on outstanding debt – crossed over $1 trillion at the end of October. That’s double what it was less than two years ago.
I don’t want to dispute the idea that the debt, deficits, and interest payments are rising at a troubling pace. The chart below clearly lays out soaring interest payments the U.S. government is making on debt, which crowds out other types of more productive spending:
Interest Payments on Gross U.S. Government Debt
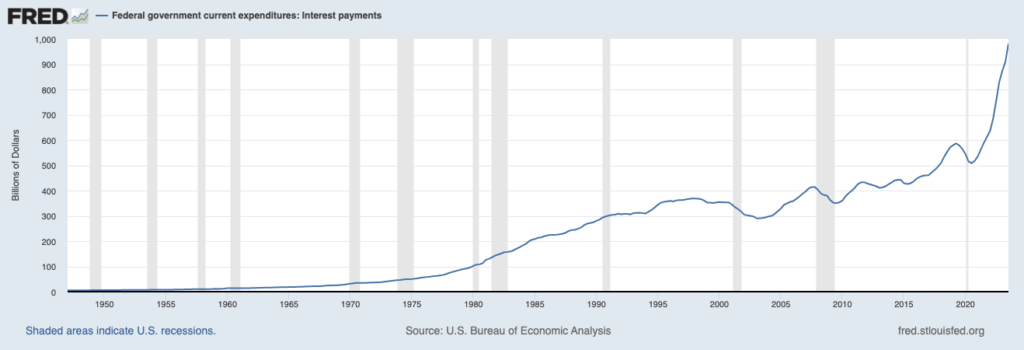
But the headline that annualized interest payments are now over $1 trillion needs some clarifying. For one, the U.S. government paid $659.2 billion in net interest in fiscal year 2023, which ended in September. So, we’re not at $1 trillion yet.
The analysis showing $1 trillion in interest payments is in reference to fiscal year 2024, but it’s also based on outstanding gross debt and the average interest rate on the debt. A more accurate calculation would consider outstanding net debt, which removes debt owned by the U.S. government (about $7 trillion).
By this measure, the U.S. government would owe an average interest rate of 2.97% on about $26 trillion of debt, which is a little less than $800 billion in interest payments in 2024. For context, $800 billion is about 18% of the roughly $4.4 trillion in revenue the U.S. government collected in 2023. If tax revenue in 2024 is higher than it was in 2023, then the percentage would scale down a bit. It’s also important to point out that 18% is roughly where interest payments as a percent of tax receipts were during most of the 1980s and 1990s, which were both solid periods for the economy and stocks.
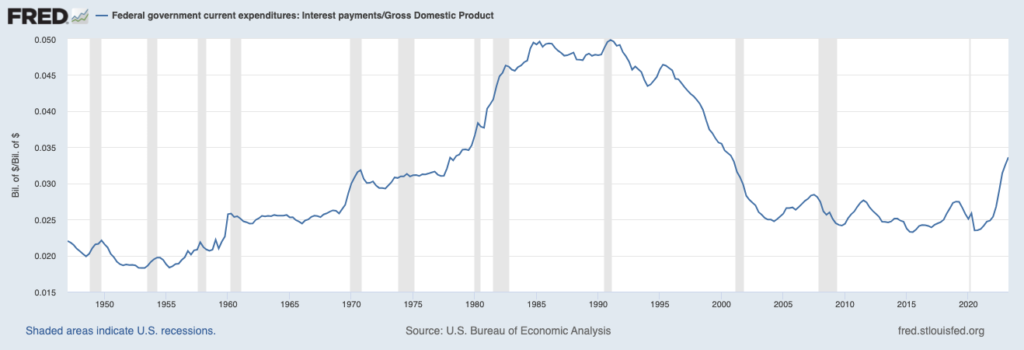
Another way to frame interest payments is as a percent of GDP, which I did in a recent column addressing deficit spending. I pointed out that high-interest rates in the late 1970s and early 1980s pushed interest costs as a percent of GDP to levels much higher than we’re seeing today, and the U.S. economy managed to work its way through it.
Federal debt interest payments as a percent of GDP
Bottom Line for Investors
There is no doubt that rising deficits amid higher interest rates could pose a headwind to economic growth. If the government finds itself spending an increasing percentage of total tax revenue on interest payments each year, it will mean having less money to spend on everything else.
It’s this “crowding out” of spending that has tended – historically at least – to spur Congress into action. Elevated interest expenses in the 1980s led to several rounds of deficit reduction legislation in that decade and in the years following, which ultimately resulted in a budget surplus in the mid-1990s. Whether or not we see similar action from Congress in the near future remains to be seen, especially since the economy remains resilient and interest rates are back at historically ‘normal’ levels.
Disclosure
2 Fred Economic Data. October 26, 2023. https://fred.stlouisfed.org/series/A091RC1Q027SBEA#0
3 Fred Economic Data. October 26, 2023. https://fred.stlouisfed.org/series/A091RC1Q027SBEA#
DISCLOSURE
Past performance is no guarantee of future results. Inherent in any investment is the potential for loss.
Zacks Investment Management, Inc. is a wholly-owned subsidiary of Zacks Investment Research. Zacks Investment Management is an independent Registered Investment Advisory firm and acts as an investment manager for individuals and institutions. Zacks Investment Research is a provider of earnings data and other financial data to institutions and to individuals.
This material is being provided for informational purposes only and nothing herein constitutes investment, legal, accounting or tax advice, or a recommendation to buy, sell or hold a security. Do not act or rely upon the information and advice given in this publication without seeking the services of competent and professional legal, tax, or accounting counsel. Publication and distribution of this article is not intended to create, and the information contained herein does not constitute, an attorney-client relationship. No recommendation or advice is being given as to whether any investment or strategy is suitable for a particular investor. It should not be assumed that any investments in securities, companies, sectors or markets identified and described were or will be profitable. All information is current as of the date of herein and is subject to change without notice. Any views or opinions expressed may not reflect those of the firm as a whole.
Any projections, targets, or estimates in this report are forward looking statements and are based on the firm’s research, analysis, and assumptions. Due to rapidly changing market conditions and the complexity of investment decisions, supplemental information and other sources may be required to make informed investment decisions based on your individual investment objectives and suitability specifications. All expressions of opinions are subject to change without notice. Clients should seek financial advice regarding the appropriateness of investing in any security or investment strategy discussed in this presentation.
Certain economic and market information contained herein has been obtained from published sources prepared by other parties. Zacks Investment Management does not assume any responsibility for the accuracy or completeness of such information. Further, no third party has assumed responsibility for independently verifying the information contained herein and accordingly no such persons make any representations with respect to the accuracy, completeness or reasonableness of the information provided herein. Unless otherwise indicated, market analysis and conclusions are based upon opinions or assumptions that Zacks Investment Management considers to be reasonable. Any investment inherently involves a high degree of risk, beyond any specific risks discussed herein.
The S&P 500 Index is a well-known, unmanaged index of the prices of 500 large-company common stocks, mainly blue-chip stocks, selected by Standard & Poor’s. The S&P 500 Index assumes reinvestment of dividends but does not reflect advisory fees. The volatility of the benchmark may be materially different from the individual performance obtained by a specific investor. An investor cannot invest directly in an index.
The Russell 1000 Growth Index is a well-known, unmanaged index of the prices of 1000 large-company growth common stocks selected by Russell. The Russell 1000 Growth Index assumes reinvestment of dividends but does not reflect advisory fees. An investor cannot invest directly in an index. The volatility of the benchmark may be materially different from the individual performance obtained by a specific investor.
Nasdaq Composite Index is the market capitalization-weighted index of over 3,300 common equities listed on the Nasdaq stock exchange. The types of securities in the index include American depositary receipts, common stocks, real estate investment trusts (REITs) and tracking stocks, as well as limited partnership interests. The index includes all Nasdaq-listed stocks that are not derivatives, preferred shares, funds, exchange-traded funds (ETFs) or debenture securities. An investor cannot invest directly in an index. The volatility of the benchmark may be materially different from the individual performance obtained by a specific investor.
The Dow Jones Industrial Average measures the daily stock market movements of 30 U.S. publicly-traded companies listed on the NASDAQ or the New York Stock Exchange (NYSE). The 30 publicly-owned companies are considered leaders in the United States economy. An investor cannot directly invest in an index. The volatility of the benchmark may be materially different from the individual performance obtained by a specific investor.
The Bloomberg Global Aggregate Index is a flagship measure of global investment grade debt from twenty-four local currency markets. This multi-currency benchmark includes treasury, government-related, corporate and securitized fixed-rate bonds from both developed and emerging markets issuers. An investor cannot invest directly in an index. The volatility of the benchmark may be materially different from the individual performance obtained by a specific investor.
The ICE Exchange-Listed Fixed & Adjustable Rate Preferred Securities Index is a modified market capitalization weighted index composed of preferred stock and securities that are functionally equivalent to preferred stock including, but not limited to, depositary preferred securities, perpetual subordinated debt and certain securities issued by banks and other financial institutions that are eligible for capital treatment with respect to such instruments akin to that received for issuance of straight preferred stock. An investor cannot invest directly in an index. The volatility of the benchmark may be materially different from the individual performance obtained by a specific investor.
The MSCI ACWI ex U.S. Index captures large and mid-cap representation across 22 of 23 Developed Markets (DM) countries (excluding the United States) and 24 Emerging Markets (EM) countries. The index covers approximately 85% of the global equity opportunity set outside the U.S. An investor cannot invest directly in an index. The volatility of the benchmark may be materially different from the individual performance obtained by a specific investor.
The Russell 2000 Index is a well-known, unmanaged index of the prices of 2000 small-cap company common stocks, selected by Russell. The Russell 2000 Index assumes reinvestment of dividends but does not reflect advisory fees. An investor cannot invest directly in an index. The volatility of the benchmark may be materially different from the individual performance obtained by a specific investor.
The S&P Mid Cap 400 provides investors with a benchmark for mid-sized companies. The index, which is distinct from the large-cap S&P 500, is designed to measure the performance of 400 mid-sized companies, reflecting the distinctive risk and return characteristics of this market segment.
The S&P 500 Pure Value index is a style-concentrated index designed to track the performance of stocks that exhibit the strongest value characteristics by using a style-attractiveness-weighting scheme. An investor cannot directly invest in an index. The volatility of the benchmark may be materially different from the individual performance obtained by a specific investor.