3 Outcomes the Equity Markets Want for Christmas This Year
Long-time readers of my Mitch on the Markets columns know my view that equity markets don’t adhere to calendars. It’s true stocks tend to do well in the final two or so months of the year with the “Santa Claus rally” being a favorite adage for many. But it’s all for naught if economic, inflation, interest rate, and earnings fundamentals aren’t supporting prices.
This year, there are three outcomes/data points that could indeed give stocks a boost in the final weeks of the year, and investors should be watching closely. Here they are:
1. Look for More Signs Moderating Inflation on November 30th
Markets received some good news on the inflation front last week, with the Labor Department reporting that core CPI was flat from September to October and rose 3.2% year-over-year. Importantly, core inflation (which excludes food and gas) from June – October rose at a 2.8% annual rate, which is a major improvement from the 5.1% pace in the first five months of 2023.1
The data makes it abundantly clear: inflation has improved greatly since last year, and has continued to get a bit better with each print.
Consumer Price Index (CPI, blue line) and Core CPI (red line)
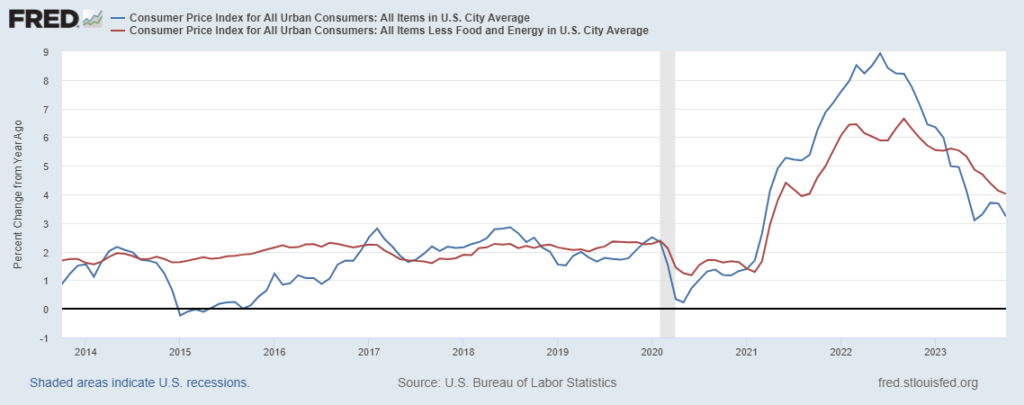
There was plenty of good news in the Labor Department’s report. Prices for cars, airfares, and housing all softened, which followed a summer when furniture and other goods prices started to come down. In housing in particular, rents for new tenants fell -2.2% from a year ago, compared to the +13.7% jump experienced last year.
In a sense, the equity markets have already received their ‘Christmas wish’ with this data, as it almost certainly implies the Federal Reserve is done hiking interest rates in 2023. But I would encourage investors to mark their calendars for November 30, when the Fed’s preferred inflation gauge – the headline personal consumption expenditures (PCE) price index – gets released. An encouraging inflation print there would all but ensure no rate hike at the December 12-13 monetary policy meeting. Instead, what investors might be better suited looking for in that Fed meeting is how their guidance shifts.
2. The U.S. Consumer Finishing the Year Strong
Economic growth in 2023 has been largely powered by the U.S. consumer, benefiting from a strong labor market. I’ve written before that the Wall Street Journal ran a headline in October that read: “Americans Are Still Spending Like There’s No Tomorrow.” That pretty much sums it up.3
Personal Consumption Expenditures are Softening But Remain Elevated
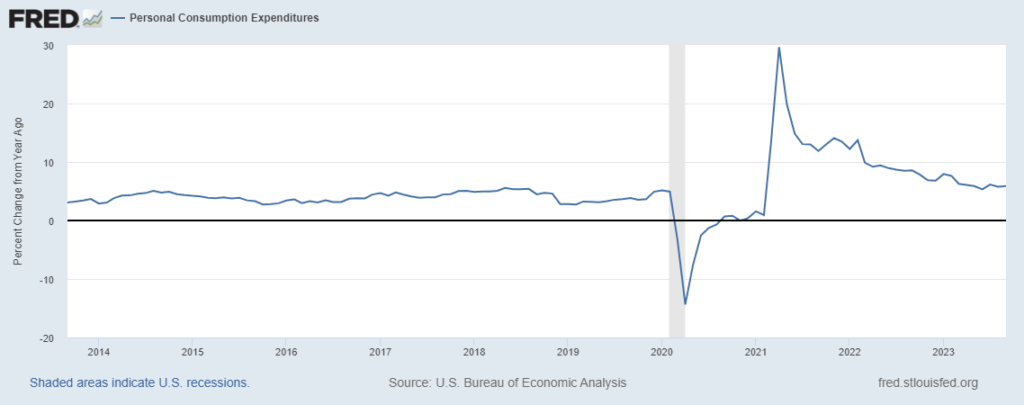
There has been some data recently, however, suggesting the U.S. consumer is losing a bit of steam just at the time it matters the most—the holiday shopping season. Let’s start with some data on goods. In the first nine months of 2023, U.S. imports of TVs, computer monitors, footwear, and games and toys fell 20% compared to a year earlier. Smartphone imports fell 16%. Retailers have been wary of building up inventories, partly because they wonder how much the consumer has left, but also because Americans have been shifting spending to services and other areas like travel and entertainment.
According to the National Retail Federation’s projections, overall sales this holiday season could rise 3% to 4%, which is quite modest compared to 5.4% in 2022, 12.7% in 2021, and 9.1% in 2020. When factoring in inflation, some analysts expect flat growth from 2022, which would register as disappointing.
The big question for equity markets in the next couple of months is, will consumers continue to defy expectations and spend more and bigger than many are anticipating? The U.S. consumer has been underestimated virtually all year. Will they exceed expectations again?
3. Corporations Show Signs of Exceeding Their Falling Earnings Estimates
With the Q3 earnings season pretty much wrapped up, we can say that the earnings picture turned a corner in the quarter. Earnings growth for the S&P 500 index, which was negative for each of the preceding three quarters, looks like it turned positive in Q3. Energy has been a drag for the past two quarters, and stripping it out, S&P earnings growth would have been positive. But now it looks like we’ll get aggregate earnings increase of +1% from the same period last year on +2.5% higher revenues.5
One factor to call out, however, is that companies have been scaling down estimates for earnings growth in Q4—substantially. The chart below shows how estimates for 2023 Q4 have evolved since the quarter got underway.
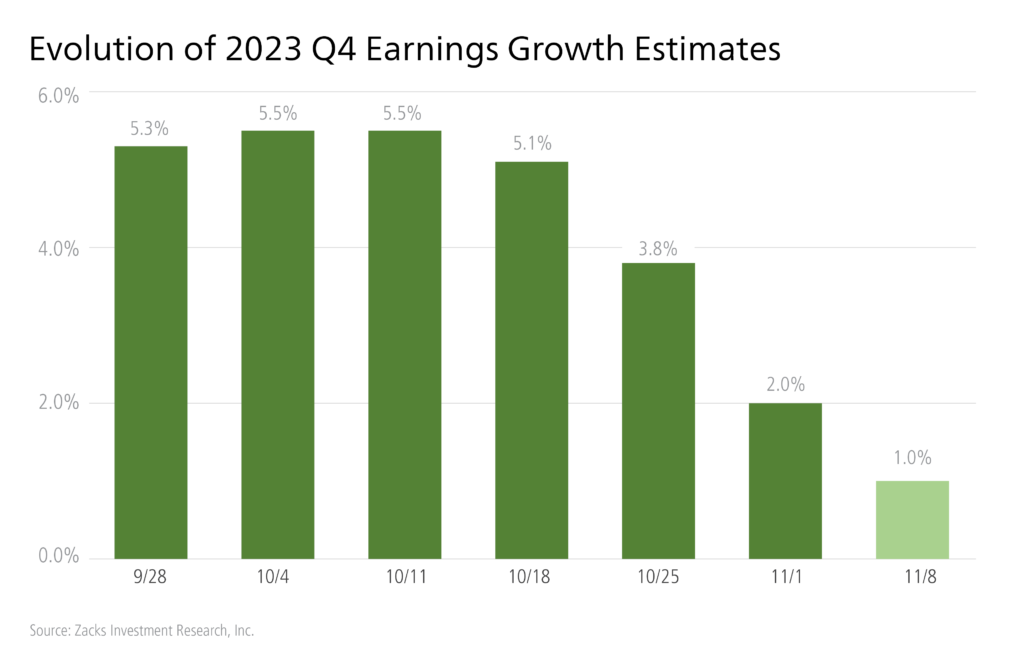
This is a bigger decline in quarterly estimates compared to the preceding two quarters, and it marks a departure from the favorable revisions trend that’s been occurring since April 2023. In the chart below, readers can see the recent pressure on full-year 2024 earnings estimates, which shows the aggregate earnings estimates for the S&P 500 index since May.
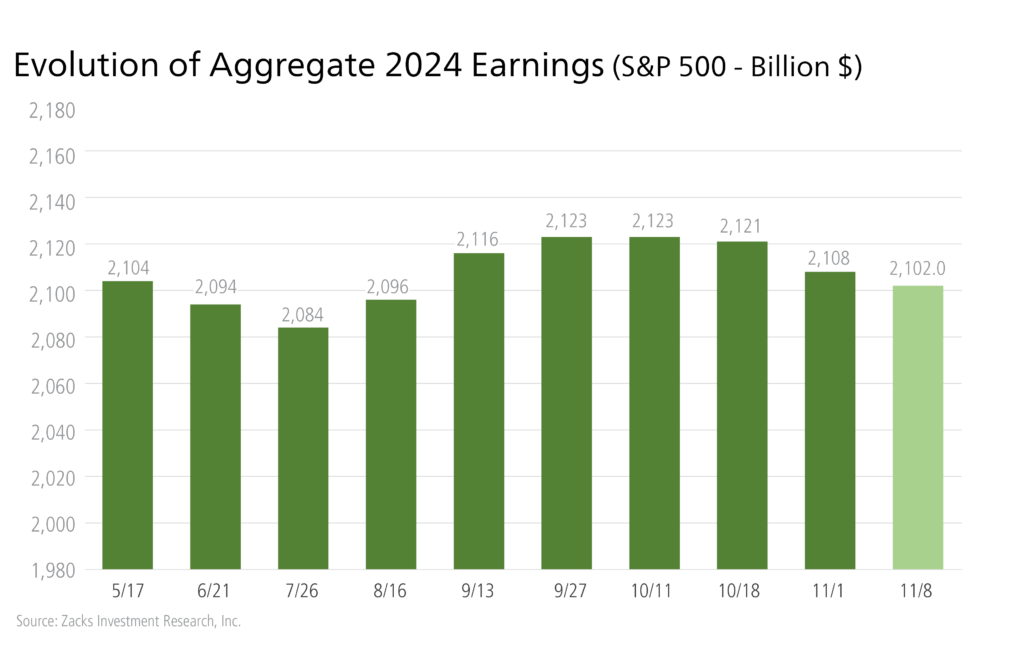
It’s common to see companies revise earnings expectations lower, especially given the recent softening in the labor market and a lot of headline warnings about the durability of the U.S. consumer. The question is, can S&P 500 companies surprise to the upside?
Bottom Line for Investors
As ever, the equity markets will often respond positively when reality exceeds expectations. For the final weeks of the year, investors should be looking for more positive momentum on inflation, a durable U.S. consumer that surprises the street with strong holiday shopping spending, and S&P 500 companies giving early indications that they revised earnings too far to the downside given ongoing economic strength. If that’s what we get, I anticipate a celebratory New Year for equity markets to follow.
Disclosure
2 Fred Economic Data. November 14, 2023. https://fred.stlouisfed.org/series/CPIAUCSL
3 Wall Street Journal. November 10, 2023. https://www.wsj.com/business/retail/five-economic-signs-youre-smart-to-procrastinate-on-holiday-shopping-this-year-2de9ed0f?mod=djemRTE_h
4 Fred Economic Data. October 27, 2023. https://fred.stlouisfed.org/series/PCE#
5 Zacks.com. November 8, 2023. https://zacks.com/commentary/2181217/earnings-estimates-come-under-pressure
DISCLOSURE
Past performance is no guarantee of future results. Inherent in any investment is the potential for loss.
Zacks Investment Management, Inc. is a wholly-owned subsidiary of Zacks Investment Research. Zacks Investment Management is an independent Registered Investment Advisory firm and acts as an investment manager for individuals and institutions. Zacks Investment Research is a provider of earnings data and other financial data to institutions and to individuals.
This material is being provided for informational purposes only and nothing herein constitutes investment, legal, accounting or tax advice, or a recommendation to buy, sell or hold a security. Do not act or rely upon the information and advice given in this publication without seeking the services of competent and professional legal, tax, or accounting counsel. Publication and distribution of this article is not intended to create, and the information contained herein does not constitute, an attorney-client relationship. No recommendation or advice is being given as to whether any investment or strategy is suitable for a particular investor. It should not be assumed that any investments in securities, companies, sectors or markets identified and described were or will be profitable. All information is current as of the date of herein and is subject to change without notice. Any views or opinions expressed may not reflect those of the firm as a whole.
Any projections, targets, or estimates in this report are forward looking statements and are based on the firm’s research, analysis, and assumptions. Due to rapidly changing market conditions and the complexity of investment decisions, supplemental information and other sources may be required to make informed investment decisions based on your individual investment objectives and suitability specifications. All expressions of opinions are subject to change without notice. Clients should seek financial advice regarding the appropriateness of investing in any security or investment strategy discussed in this presentation.
Certain economic and market information contained herein has been obtained from published sources prepared by other parties. Zacks Investment Management does not assume any responsibility for the accuracy or completeness of such information. Further, no third party has assumed responsibility for independently verifying the information contained herein and accordingly no such persons make any representations with respect to the accuracy, completeness or reasonableness of the information provided herein. Unless otherwise indicated, market analysis and conclusions are based upon opinions or assumptions that Zacks Investment Management considers to be reasonable. Any investment inherently involves a high degree of risk, beyond any specific risks discussed herein.
The S&P 500 Index is a well-known, unmanaged index of the prices of 500 large-company common stocks, mainly blue-chip stocks, selected by Standard & Poor’s. The S&P 500 Index assumes reinvestment of dividends but does not reflect advisory fees. The volatility of the benchmark may be materially different from the individual performance obtained by a specific investor. An investor cannot invest directly in an index.
The Russell 1000 Growth Index is a well-known, unmanaged index of the prices of 1000 large-company growth common stocks selected by Russell. The Russell 1000 Growth Index assumes reinvestment of dividends but does not reflect advisory fees. An investor cannot invest directly in an index. The volatility of the benchmark may be materially different from the individual performance obtained by a specific investor.
Nasdaq Composite Index is the market capitalization-weighted index of over 3,300 common equities listed on the Nasdaq stock exchange. The types of securities in the index include American depositary receipts, common stocks, real estate investment trusts (REITs) and tracking stocks, as well as limited partnership interests. The index includes all Nasdaq-listed stocks that are not derivatives, preferred shares, funds, exchange-traded funds (ETFs) or debenture securities. An investor cannot invest directly in an index. The volatility of the benchmark may be materially different from the individual performance obtained by a specific investor.
The Dow Jones Industrial Average measures the daily stock market movements of 30 U.S. publicly-traded companies listed on the NASDAQ or the New York Stock Exchange (NYSE). The 30 publicly-owned companies are considered leaders in the United States economy. An investor cannot directly invest in an index. The volatility of the benchmark may be materially different from the individual performance obtained by a specific investor.
The Bloomberg Global Aggregate Index is a flagship measure of global investment grade debt from twenty-four local currency markets. This multi-currency benchmark includes treasury, government-related, corporate and securitized fixed-rate bonds from both developed and emerging markets issuers. An investor cannot invest directly in an index. The volatility of the benchmark may be materially different from the individual performance obtained by a specific investor.
The ICE Exchange-Listed Fixed & Adjustable Rate Preferred Securities Index is a modified market capitalization weighted index composed of preferred stock and securities that are functionally equivalent to preferred stock including, but not limited to, depositary preferred securities, perpetual subordinated debt and certain securities issued by banks and other financial institutions that are eligible for capital treatment with respect to such instruments akin to that received for issuance of straight preferred stock. An investor cannot invest directly in an index. The volatility of the benchmark may be materially different from the individual performance obtained by a specific investor.
The MSCI ACWI ex U.S. Index captures large and mid-cap representation across 22 of 23 Developed Markets (DM) countries (excluding the United States) and 24 Emerging Markets (EM) countries. The index covers approximately 85% of the global equity opportunity set outside the U.S. An investor cannot invest directly in an index. The volatility of the benchmark may be materially different from the individual performance obtained by a specific investor.
The Russell 2000 Index is a well-known, unmanaged index of the prices of 2000 small-cap company common stocks, selected by Russell. The Russell 2000 Index assumes reinvestment of dividends but does not reflect advisory fees. An investor cannot invest directly in an index. The volatility of the benchmark may be materially different from the individual performance obtained by a specific investor.
The S&P Mid Cap 400 provides investors with a benchmark for mid-sized companies. The index, which is distinct from the large-cap S&P 500, is designed to measure the performance of 400 mid-sized companies, reflecting the distinctive risk and return characteristics of this market segment.
The S&P 500 Pure Value index is a style-concentrated index designed to track the performance of stocks that exhibit the strongest value characteristics by using a style-attractiveness-weighting scheme. An investor cannot directly invest in an index. The volatility of the benchmark may be materially different from the individual performance obtained by a specific investor.