The Federal Reserve is on a mission to tamp inflation, but they have one key problem: central banks can’t control the supply of goods and services. As a result, the Fed is aggressively targeting the demand side of the equation by raising interest rates and shrinking its balance sheet at a rapid clip. Their moves have tightened financial conditions in the first half of 2022, which is part of what’s driven the rapid downdraft in equity markets.
Whether or not inflation starts to moderate in future months is a key question not only for policymakers but also for equity market investors. If inflation pressures begin to subside in the second half of the year, it could remove pressure from the Federal Reserve to tighten monetary policy so aggressively, which could provide some relief to equity markets in the second half. I think there’s a good chance this happens before the end of the year.
Market-based inflation indicators have been signaling expectations that inflation could start to moderate from here. Both the 5-year and 10-year breakeven inflation rates have come down sharply from April and May highs:
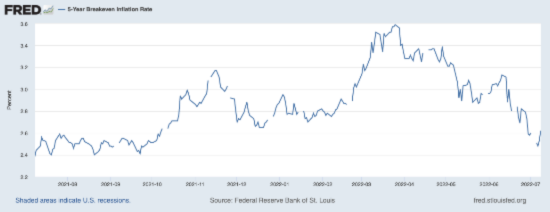
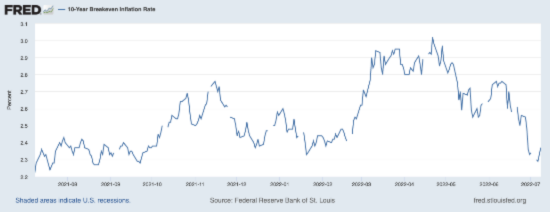
Again, if inflation and inflation expectations fall over the coming quarters, the Federal Reserve may be able to shift down to 25 or 50 basis point increases, and they could ultimately set a clearer timeframe for policy trajectory in the new year. All of these developments would be good for stocks, in my view.
I’m watching three factors in the second half of the year that could be key in influencing inflation pressures and, by extension, the Fed’s path of monetary tightening.
- Global Supply Chain Pressures
Many often frame inflation as an issue rooted in easy Fed policy and too-generous government stimulus programs. But the reality of inflation is more complex, being driven by an overwhelming shift to demand for goods (versus services) just as supply issues were being mired by lockdowns, rising costs of labor and raw materials, snarled supply chains, and geopolitical crises. In normal times, the global economy could have absorbed all of the stimulus-related demand, but these of course were not normal times.
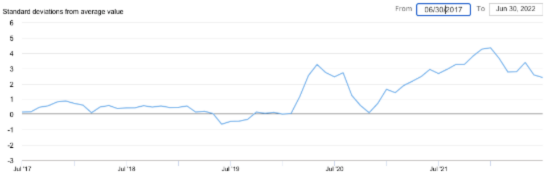
It has been a long road to recovery for supply chains, which were hampered even further by the war in Ukraine and new lockdowns in China. But signs are pointing to some of the stresses being relieved. The New York Fed’s Global Supply Chain Pressure Index has been falling over the past few weeks, which gathers data from shipping and airfreight indicators as well as PMI surveys from key countries like the US, China, Japan, and South Korea. As seen on the chart below, pressure is easing and supply delivery times are falling from highs – both good signs.
Global Supply Chain Pressure Index
- Falling Commodity Prices
Another major pressure point for inflation over the past several months has been rising commodity prices, particularly the price of a barrel of oil. Higher oil prices ripple across the economy, as they affect everything from shipping rates to gas prices to the cost of an airline ticket. But there has also been pressure in many other raw materials, like lumber, wheat, and even cotton.
These price pressures may be starting to abate. Natural gas prices, for instance, soared over 60% in April and May, but then plummeted in June to finish the quarter down -3.9% (see chart below).
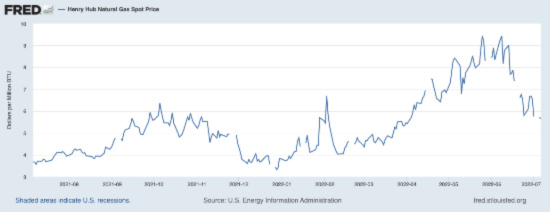
There was no hiding in commodity markets in June—wheat, corn, copper, and lumber prices all fell by double-digits, while oil fell sharply from early June highs. Supply and demand forces played a key role, but it also appears that markets were pricing in a slower overall pace of global economic growth in the quarters ahead. That could be good news for Fed policy.
- Rising Jobless Claims
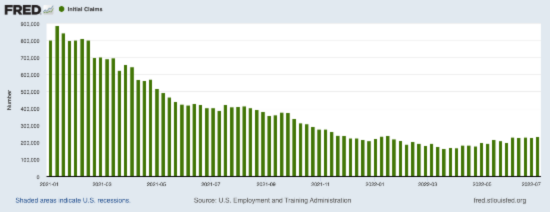
The U.S. labor market remains historically tight. In June, employers added 372,000 new hires for the month, which blew past economist expectations. Bizarrely enough, the Federal Reserve is keen to see the jobs market cool off since tight labor conditions tend to push up wages which leads to more inflation. We’re not seeing any significant labor market pressure yet, but the 4-week moving average of initial jobless claims has been ticking slightly higher over the past three months, which could be an early sign that the red-hot jobs market is leveling off a bit.
Initial Jobless Claims
Bottom Line for Investors
The Federal Reserve’s efforts to cool demand in the economy may coincide with easing inflation later this year, which may make it appear as though the Fed saved the day. But the reality of the inflation issue is that pressures will ease once commodity markets cool off and once the supply and demand of goods find equilibrium, which I see more as a supply issue than a demand issue. In other words, it may look like the Fed’s actions brought inflation down, but in reality, the supply of goods and services just became more abundant.
Either way, an easing of inflation pressures would be a positive for investor sentiment and would also remove pressure from the Fed to tighten so quickly, both of which would be good for markets. That’s what I see in the second half.
Disclosure
2 Fred Economic Data. July 11, 2022. https://fred.stlouisfed.org/series/T10YIE#
3 Federal Reserve Bank of New York. June 2022. https://www.newyorkfed.org/research/policy/gscpi#/interactive
4 Fred Economic Data. July 6, 2022. https://fred.stlouisfed.org/series/DHHNGSP#
5 Fred Economic Data. July 2, 2022. https://fred.stlouisfed.org/series/ICSA#
DISCLOSURE
Past performance is no guarantee of future results. Inherent in any investment is the potential for loss.
Zacks Investment Management, Inc. is a wholly-owned subsidiary of Zacks Investment Research. Zacks Investment Management is an independent Registered Investment Advisory firm and acts as an investment manager for individuals and institutions. Zacks Investment Research is a provider of earnings data and other financial data to institutions and to individuals.
This material is being provided for informational purposes only and nothing herein constitutes investment, legal, accounting or tax advice, or a recommendation to buy, sell or hold a security. Do not act or rely upon the information and advice given in this publication without seeking the services of competent and professional legal, tax, or accounting counsel. Publication and distribution of this article is not intended to create, and the information contained herein does not constitute, an attorney-client relationship. No recommendation or advice is being given as to whether any investment or strategy is suitable for a particular investor. It should not be assumed that any investments in securities, companies, sectors or markets identified and described were or will be profitable. All information is current as of the date of herein and is subject to change without notice. Any views or opinions expressed may not reflect those of the firm as a whole.
Any projections, targets, or estimates in this report are forward looking statements and are based on the firm’s research, analysis, and assumptions. Due to rapidly changing market conditions and the complexity of investment decisions, supplemental information and other sources may be required to make informed investment decisions based on your individual investment objectives and suitability specifications. All expressions of opinions are subject to change without notice. Clients should seek financial advice regarding the appropriateness of investing in any security or investment strategy discussed in this presentation.
Certain economic and market information contained herein has been obtained from published sources prepared by other parties. Zacks Investment Management does not assume any responsibility for the accuracy or completeness of such information. Further, no third party has assumed responsibility for independently verifying the information contained herein and accordingly no such persons make any representations with respect to the accuracy, completeness or reasonableness of the information provided herein. Unless otherwise indicated, market analysis and conclusions are based upon opinions or assumptions that Zacks Investment Management considers to be reasonable. Any investment inherently involves a high degree of risk, beyond any specific risks discussed herein.
The S&P 500 Index is a well-known, unmanaged index of the prices of 500 large-company common stocks, mainly blue-chip stocks, selected by Standard & Poor’s. The S&P 500 Index assumes reinvestment of dividends but does not reflect advisory fees. The volatility of the benchmark may be materially different from the individual performance obtained by a specific investor. An investor cannot invest directly in an index.
The Russell 1000 Growth Index is a well-known, unmanaged index of the prices of 1000 large-company growth common stocks selected by Russell. The Russell 1000 Growth Index assumes reinvestment of dividends but does not reflect advisory fees. An investor cannot invest directly in an index. The volatility of the benchmark may be materially different from the individual performance obtained by a specific investor.
Nasdaq Composite Index is the market capitalization-weighted index of over 3,300 common equities listed on the Nasdaq stock exchange. The types of securities in the index include American depositary receipts, common stocks, real estate investment trusts (REITs) and tracking stocks, as well as limited partnership interests. The index includes all Nasdaq-listed stocks that are not derivatives, preferred shares, funds, exchange-traded funds (ETFs) or debenture securities. An investor cannot invest directly in an index. The volatility of the benchmark may be materially different from the individual performance obtained by a specific investor.
The Dow Jones Industrial Average measures the daily stock market movements of 30 U.S. publicly-traded companies listed on the NASDAQ or the New York Stock Exchange (NYSE). The 30 publicly-owned companies are considered leaders in the United States economy. An investor cannot directly invest in an index. The volatility of the benchmark may be materially different from the individual performance obtained by a specific investor.