The turn of a new year means weighing new factors that could impact markets. Investors must also remember, though, that forward-looking views come with blind spots—extraneous factors that appear without notice, creating positive and negative surprises that can help and hurt markets. Readers will recall that in 2022, Russia did not invade Ukraine until late February, making the disruptions to global commodity markets and the effects on inflation very hard to forecast on January 1st.
That being said, I do see a few macroeconomic forces likely to play key roles in the trajectory for economic growth, interest rates, inflation, earnings, and market returns in 2023. Here are three I think investors should watch closely.
- When and Where Will Interest Rates Peak?
There is strong data indicating that goods inflation has peaked. Supply constraints like closed factories, higher shipping costs, and snarled supply chains have largely faded. Falling housing prices and lower prices on new rental leases indicate that the sticky “shelter and owners’ equivalent rent” component of inflation will come down. The impact of higher prices for used cars, semiconductors, and airfares appears to have run its course, and energy prices have also retreated from peaks.
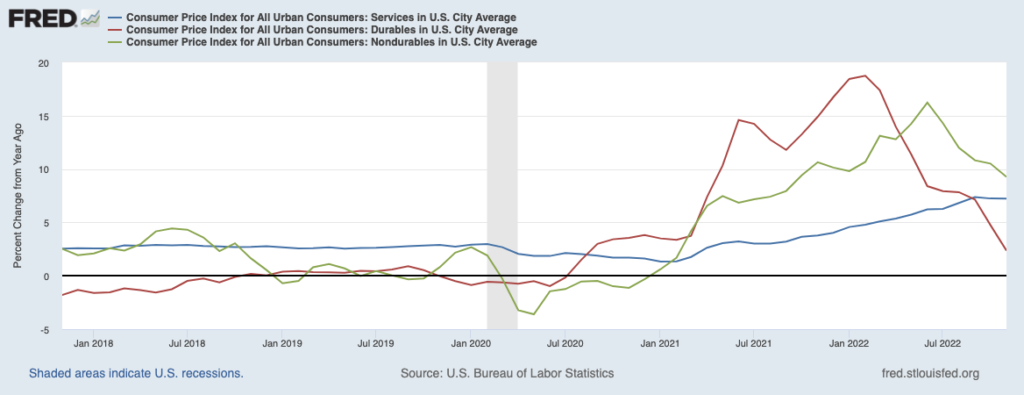
That’s all-positive news. The problem today is that services inflation has not come down alongside goods inflation, and in fact may be trending in the wrong direction. A big factor driving services inflation is the tight labor market, where labor scarcity continues to drive up wages. As wages move higher, the cost of doing business rises, which filters through to higher prices charged for services. As readers can see in the chart below, categories of goods inflation (green and red lines) peaked several months ago, but services inflation (blue line) continues to trend higher.
Goods Inflation Has Peaked, But Services Inflation Remains Elevated
The inflation picture matters because it has outsized influence over the Federal Reserve’s approach to monetary policy. In 2022, the market was repeatedly wrong about inflation and projections for the fed funds terminal rate, and every shift higher drove heightened market volatility. Expectations for peak fed funds now stand at 5% to 5.25% by mid-20232, but the market may still be too optimistic about when rates will start to come down. There are plenty of historical cases of the Fed loosening too soon before the inflation battle was won, which Chairman Powell is acutely aware of.
- Will the U.S. Enter a Recession, and Will Jobs be Lost?
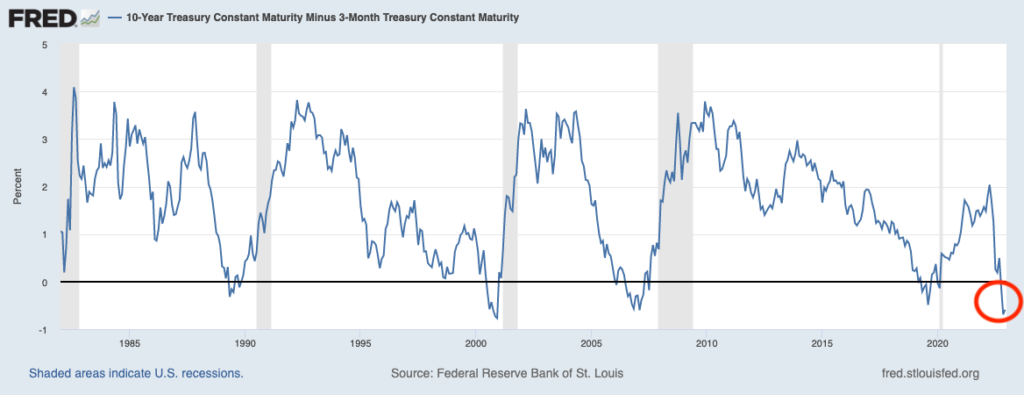
On the economic front, earnings estimates are coming down and S&P 500 profit margins have peaked, which generally implies an economic slowdown is underway or very close. My preferred measure of the yield curve—which is the difference between the yield on the 3-month U.S. Treasury bond yield and the 10-year Treasury bond yield—is also inverted, which has been a strong recession signal historically as it implies unprofitable lending conditions for banks.
Yield Curve Inversions Historically Precede Economic Recessions
It may seem counterintuitive, but a mild economic downturn may be good news—bull markets tend to start during recessions, and also about 6-9 months before a trough in earnings. Stocks also tend to perform best when growth is weak but improving, rather than when it is strong but slowing. We may be close to seeing these conditions.
The U.S. labor market continues to frustrate the Fed while puzzling economists and market watchers. Even as financial conditions tighten and an economic slowdown loom, there are still far more open jobs in the U.S. economy than there are unemployed people. Companies have been raising wages to keep key workers, which has been buttressing household balance sheets and consumer spending. Layoffs have been reported in mostly the tech sector, which accounts for a small percentage of overall jobs in the economy. As it stands now, there are 10 million open jobs in the economy:
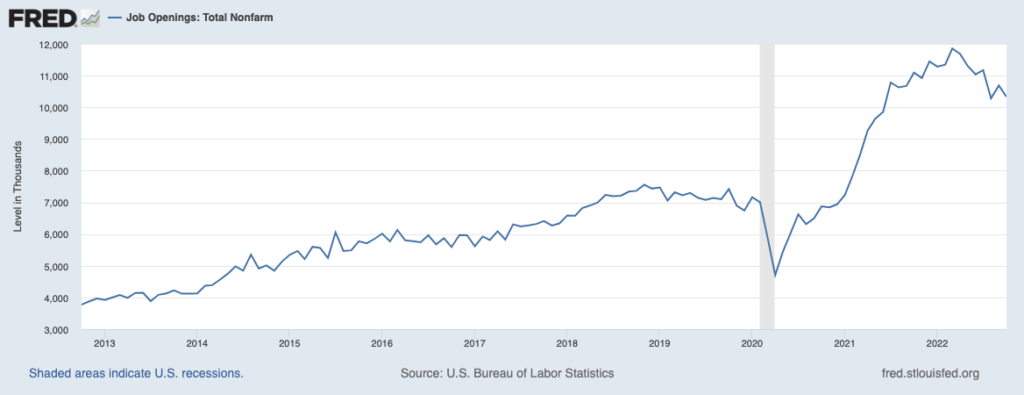
Supply and demand are clearly off balance in the labor market, and the Fed wants desperately to bring it back into balance. The optimistic view is that the Fed could theoretically achieve this goal by reducing the number of job openings instead of slowing the economy to the point of triggering layoffs. Whether or not they accomplish this goal will be key to watch in the new year.
- China’s Economic Reopening – Bumpy or Smooth?
China’s economy is finishing the year with a whimper, an extension of troubles experienced throughout 2022. In November, due to continued restrictions and lockdowns associated with “zero-Covid,” China’s economy suffered setbacks as retail sales plummeted by 5.9% year-over-year. Unemployment in major cities rose from 5.5% in October to 5.7% in November, and the youth unemployment rate remains above 20%. Industrial production also plateaued in the month as factories were hit with the double-whammy of Covid restrictions and falling global demand. Overall, it was a bad year for China, which also likely weighed significantly on global stocks.5
But there is good reason to believe China could experience a turnaround in 2023, particularly as protests and urging from businesses has led to an easing of Covid restrictions and a shift to broader economic reopening. China appears to be following through – beginning January 8, the country will lift rules requiring foreign visitors to quarantine upon arrival, instead requiring only a negative test within the previous 48 hours. This move and others are real steps towards reopening, but it remains to be seen whether a surge in cases and deaths this winter will cause the government to snap restrictions back into place. For now, China’s government is forecasting 5% GDP growth in the new year, and many Wall Street banks and economists see the growth even higher.
Bottom Line for Investors
The most optimistic case for the new year involves positive outcomes for each of the three factors listed above, in my view. That means the fed funds rate would peak sometime in the summer, the U.S. may enter a mild recession where job openings fall briskly versus layoffs rising, and China resumes a full reopening and a surge in economic activity.
On the flip side, services inflation could continue to move higher, forcing the Fed to increase the terminal fed funds projection once again and lift the fed funds rate through the summer; a deeper recession could result in layoffs and a rise in the unemployment rate; and, China could restore strict Covid lockdowns and restrictions that hamstring its economy again in 2023.
Investors should look for clues throughout the year that indicate which scenarios are most likely, and make your bull or bear cases accordingly.
Disclosure
2 USA Today. December 14, 2022. https://www.usatoday.com/story/money/economy/2022/12/14/fed-interest-rate-federal-reserve-meeting-live-updates/10867165002/
3 Fred Economic Data. December 27, 2022. https://fred.stlouisfed.org/series/T10Y3M#
4 Fred Economic Data. November 30, 2022. https://fred.stlouisfed.org/series/JTSJOL#
5 Wall Street Journal. December 26, 2022. https://www.wsj.com/articles/china-to-open-borders-despite-surge-in-covid-19-cases-11672073476
DISCLOSURE
Past performance is no guarantee of future results. Inherent in any investment is the potential for loss.
Zacks Investment Management, Inc. is a wholly-owned subsidiary of Zacks Investment Research. Zacks Investment Management is an independent Registered Investment Advisory firm and acts as an investment manager for individuals and institutions. Zacks Investment Research is a provider of earnings data and other financial data to institutions and to individuals.
This material is being provided for informational purposes only and nothing herein constitutes investment, legal, accounting or tax advice, or a recommendation to buy, sell or hold a security. Do not act or rely upon the information and advice given in this publication without seeking the services of competent and professional legal, tax, or accounting counsel. Publication and distribution of this article is not intended to create, and the information contained herein does not constitute, an attorney-client relationship. No recommendation or advice is being given as to whether any investment or strategy is suitable for a particular investor. It should not be assumed that any investments in securities, companies, sectors or markets identified and described were or will be profitable. All information is current as of the date of herein and is subject to change without notice. Any views or opinions expressed may not reflect those of the firm as a whole.
Any projections, targets, or estimates in this report are forward looking statements and are based on the firm’s research, analysis, and assumptions. Due to rapidly changing market conditions and the complexity of investment decisions, supplemental information and other sources may be required to make informed investment decisions based on your individual investment objectives and suitability specifications. All expressions of opinions are subject to change without notice. Clients should seek financial advice regarding the appropriateness of investing in any security or investment strategy discussed in this presentation.
Certain economic and market information contained herein has been obtained from published sources prepared by other parties. Zacks Investment Management does not assume any responsibility for the accuracy or completeness of such information. Further, no third party has assumed responsibility for independently verifying the information contained herein and accordingly no such persons make any representations with respect to the accuracy, completeness or reasonableness of the information provided herein. Unless otherwise indicated, market analysis and conclusions are based upon opinions or assumptions that Zacks Investment Management considers to be reasonable. Any investment inherently involves a high degree of risk, beyond any specific risks discussed herein.
The S&P 500 Index is a well-known, unmanaged index of the prices of 500 large-company common stocks, mainly blue-chip stocks, selected by Standard & Poor’s. The S&P 500 Index assumes reinvestment of dividends but does not reflect advisory fees. The volatility of the benchmark may be materially different from the individual performance obtained by a specific investor. An investor cannot invest directly in an index.
The Russell 1000 Growth Index is a well-known, unmanaged index of the prices of 1000 large-company growth common stocks selected by Russell. The Russell 1000 Growth Index assumes reinvestment of dividends but does not reflect advisory fees. An investor cannot invest directly in an index. The volatility of the benchmark may be materially different from the individual performance obtained by a specific investor.
Nasdaq Composite Index is the market capitalization-weighted index of over 3,300 common equities listed on the Nasdaq stock exchange. The types of securities in the index include American depositary receipts, common stocks, real estate investment trusts (REITs) and tracking stocks, as well as limited partnership interests. The index includes all Nasdaq-listed stocks that are not derivatives, preferred shares, funds, exchange-traded funds (ETFs) or debenture securities. An investor cannot invest directly in an index. The volatility of the benchmark may be materially different from the individual performance obtained by a specific investor.
The Dow Jones Industrial Average measures the daily stock market movements of 30 U.S. publicly-traded companies listed on the NASDAQ or the New York Stock Exchange (NYSE). The 30 publicly-owned companies are considered leaders in the United States economy. An investor cannot directly invest in an index. The volatility of the benchmark may be materially different from the individual performance obtained by a specific investor.
The Bloomberg Global Aggregate Index is a flagship measure of global investment grade debt from twenty-four local currency markets. This multi-currency benchmark includes treasury, government-related, corporate and securitized fixed-rate bonds from both developed and emerging markets issuers. An investor cannot invest directly in an index. The volatility of the benchmark may be materially different from the individual performance obtained by a specific investor.
The ICE Exchange-Listed Fixed & Adjustable Rate Preferred Securities Index is a modified market capitalization weighted index composed of preferred stock and securities that are functionally equivalent to preferred stock including, but not limited to, depositary preferred securities, perpetual subordinated debt and certain securities issued by banks and other financial institutions that are eligible for capital treatment with respect to such instruments akin to that received for issuance of straight preferred stock. An investor cannot invest directly in an index. The volatility of the benchmark may be materially different from the individual performance obtained by a specific investor.