Is the Market Finally Getting The “Certainty” Needed for a Sustained Rally?
Markets don’t like uncertainty. And in the late summer and early fall, uncertainty is what the markets got.
In early August, the company Fitch Ratings lowered its rating on the U.S. to AA+, one notch down from the top AAA grade. The downgrade came nearly two months after a debt ceiling deal was struck – with worries about debt default gone – but the headline risk was enough to unsettle markets.1
Later in the month, news kept emerging from China that the world’s second-largest economy was in trouble, with a beleaguered property market, weak exports, and sagging consumer spending. Meanwhile, the global price of a barrel of crude oil kept climbing from July, rising over 20% in just a few weeks (likely because of weak China demand coupled with Saudi and Russian production cuts). Interest rates also made a significant move higher, with the 10-year U.S. Treasury bond climbing from 3.86% at the beginning of July to 4.88% by the end of October. Stocks sank as rates rose.
To top it all off, on October 7th, Hamas attacked Israel setting off a second war in addition to the Russia – Ukraine conflict. Markets were jittery as everyone wondered if the war would escalate into a regional conflict, involving other countries.
Uncertainty prevailed.
Looking ahead to the last few weeks of the year, however, I think markets are starting to see a clearer path forward, particularly in three areas that matter most: inflation, interest rates, and earnings. Below, I walk through each.
1. Inflation and the Central Banks
If we’re reading between the lines, virtually every developed world central bank has indicated that they are done raising rates in this cycle. I say “reading between the lines” because no central bank has declared they’re done – it’s more about posturing/positioning while also keeping in mind economic data across each country.
At their most recent meetings, the Federal Reserve, the European Central Bank, and the Bank of England all left rates unchanged. In the U.S., with long rates pressured higher and the Fed no longer convinced that higher unemployment and weak economic growth are needed to pull inflation lower, all signs point to a long pause – perhaps followed by cuts sometime in 2024.
Inflation pressures continue to ease globally, and the likelihood of slower growth (see next point) should temper consumer spending (demand) enough to force corporations and small businesses to pull back on raising prices.
Why this all matters: when the Fed has finished hiking rates historically, stocks have performed well with the interest rate ‘certainty’ that comes with it. In the previous seven Fed hiking cycles, stocks and investment-grade bonds outperformed cash by 19% and 14%, respectively, over the following two years.
2. Slowing Growth and Interest Rates
Recent economic data in manufacturing, services, and even the labor markets have pointed to fading economic growth momentum – which investors should view as a positive. But the U.S. economy is also giving another signal of a potential ‘soft landing’ via gains in productivity.
The latest productivity print – which measures how much workers produce per hour – showed the biggest gain in three years. Unit labor costs also fell, which reduces a company’s need to pass along rising costs through higher prices. This data suggests the businesses may be landing in some form of equilibrium – not too hot, not too cold – where growth moderates but can be maintained. As interest rates tend to respond to changes in growth rates and growth expectations, this data suggests upward pressure on rates could too be fading.
Bond markets received some other good news in November as well, when the U.S. Treasury said it plans to borrow less in Q4 than previously anticipated, while also indicating its intent to issue fewer longer-dated bonds. These developments arguably ease market worries about too much supply of new bonds, and provide additional ‘certainty’ on rates looking ahead.
3. Earnings Turning a Corner
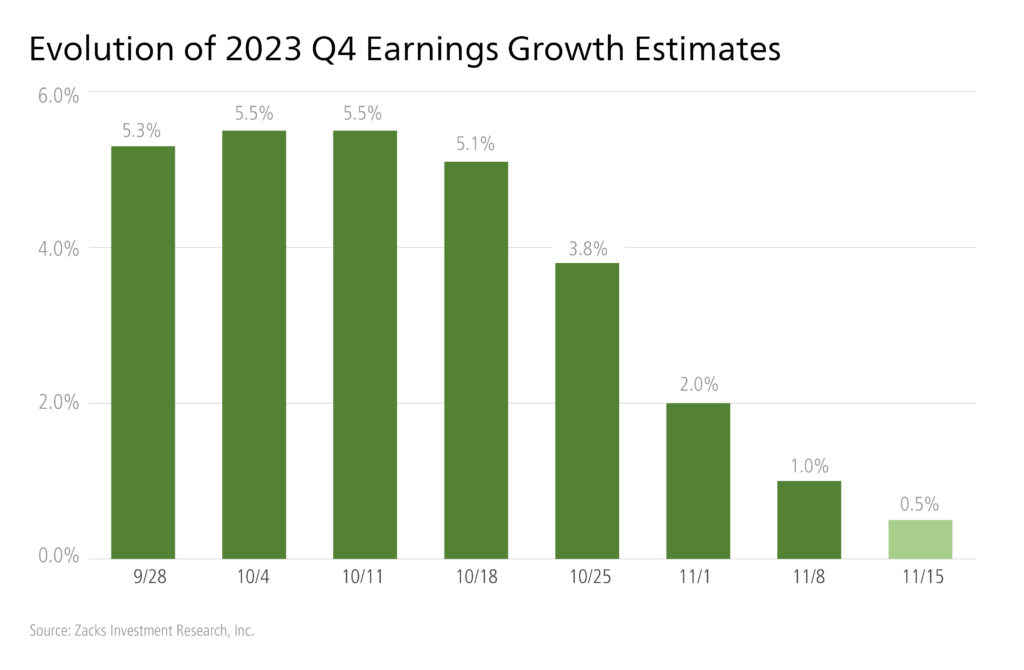
With Q3 2023 earnings season behind us, we can say the overall earnings picture remains stable and largely positive. Earnings growth for the S&P 500 index, which was negative for each of the preceding three quarters, turned positive in Q3, even with a continued Energy drag. The earnings growth pace is expected to steadily improve in the coming periods – uncertainty turned to certainty.2
One factor to flag is that earnings estimates for Q4 have been coming down, as seen in the chart below. I would reframe this as a positive, however, as it makes exceeding earnings expectations in the final quarter of the year easier.
Bottom Line for Investors
With major central banks posturing to stop rate hikes, inflation still in a downtrend, upward pressure on interest rates easing as the economic growth shifts lower, and earnings growth turning a corner, I would argue that the market is seeing some ‘uncertainty relief’ as compared to summer and early fall. The geopolitical situation is still unsettling, but markets have already priced in the economic impact of both wars, in my view.
Looking ahead, if the U.S. economy experiences slower growth in Q4 while inflation ticks lower and the Fed stays on hold, I think markets will start looking much further ahead to an ongoing earnings recovery and the possibility of a rate cut on the horizon.
Disclosure
2 Zacks. November 15, 2023. https://www.zacks.com/commentary/2184940/earnings-estimates-moving-lower-as-growth-moderates
DISCLOSURE
Past performance is no guarantee of future results. Inherent in any investment is the potential for loss.
Zacks Investment Management, Inc. is a wholly-owned subsidiary of Zacks Investment Research. Zacks Investment Management is an independent Registered Investment Advisory firm and acts as an investment manager for individuals and institutions. Zacks Investment Research is a provider of earnings data and other financial data to institutions and to individuals.
This material is being provided for informational purposes only and nothing herein constitutes investment, legal, accounting or tax advice, or a recommendation to buy, sell or hold a security. Do not act or rely upon the information and advice given in this publication without seeking the services of competent and professional legal, tax, or accounting counsel. Publication and distribution of this article is not intended to create, and the information contained herein does not constitute, an attorney-client relationship. No recommendation or advice is being given as to whether any investment or strategy is suitable for a particular investor. It should not be assumed that any investments in securities, companies, sectors or markets identified and described were or will be profitable. All information is current as of the date of herein and is subject to change without notice. Any views or opinions expressed may not reflect those of the firm as a whole.
Any projections, targets, or estimates in this report are forward looking statements and are based on the firm’s research, analysis, and assumptions. Due to rapidly changing market conditions and the complexity of investment decisions, supplemental information and other sources may be required to make informed investment decisions based on your individual investment objectives and suitability specifications. All expressions of opinions are subject to change without notice. Clients should seek financial advice regarding the appropriateness of investing in any security or investment strategy discussed in this presentation.
Certain economic and market information contained herein has been obtained from published sources prepared by other parties. Zacks Investment Management does not assume any responsibility for the accuracy or completeness of such information. Further, no third party has assumed responsibility for independently verifying the information contained herein and accordingly no such persons make any representations with respect to the accuracy, completeness or reasonableness of the information provided herein. Unless otherwise indicated, market analysis and conclusions are based upon opinions or assumptions that Zacks Investment Management considers to be reasonable. Any investment inherently involves a high degree of risk, beyond any specific risks discussed herein.
The S&P 500 Index is a well-known, unmanaged index of the prices of 500 large-company common stocks, mainly blue-chip stocks, selected by Standard & Poor’s. The S&P 500 Index assumes reinvestment of dividends but does not reflect advisory fees. The volatility of the benchmark may be materially different from the individual performance obtained by a specific investor. An investor cannot invest directly in an index.
The Russell 1000 Growth Index is a well-known, unmanaged index of the prices of 1000 large-company growth common stocks selected by Russell. The Russell 1000 Growth Index assumes reinvestment of dividends but does not reflect advisory fees. An investor cannot invest directly in an index. The volatility of the benchmark may be materially different from the individual performance obtained by a specific investor.
Nasdaq Composite Index is the market capitalization-weighted index of over 3,300 common equities listed on the Nasdaq stock exchange. The types of securities in the index include American depositary receipts, common stocks, real estate investment trusts (REITs) and tracking stocks, as well as limited partnership interests. The index includes all Nasdaq-listed stocks that are not derivatives, preferred shares, funds, exchange-traded funds (ETFs) or debenture securities. An investor cannot invest directly in an index. The volatility of the benchmark may be materially different from the individual performance obtained by a specific investor.
The Dow Jones Industrial Average measures the daily stock market movements of 30 U.S. publicly-traded companies listed on the NASDAQ or the New York Stock Exchange (NYSE). The 30 publicly-owned companies are considered leaders in the United States economy. An investor cannot directly invest in an index. The volatility of the benchmark may be materially different from the individual performance obtained by a specific investor.
The Bloomberg Global Aggregate Index is a flagship measure of global investment grade debt from twenty-four local currency markets. This multi-currency benchmark includes treasury, government-related, corporate and securitized fixed-rate bonds from both developed and emerging markets issuers. An investor cannot invest directly in an index. The volatility of the benchmark may be materially different from the individual performance obtained by a specific investor.
The ICE Exchange-Listed Fixed & Adjustable Rate Preferred Securities Index is a modified market capitalization weighted index composed of preferred stock and securities that are functionally equivalent to preferred stock including, but not limited to, depositary preferred securities, perpetual subordinated debt and certain securities issued by banks and other financial institutions that are eligible for capital treatment with respect to such instruments akin to that received for issuance of straight preferred stock. An investor cannot invest directly in an index. The volatility of the benchmark may be materially different from the individual performance obtained by a specific investor.
The MSCI ACWI ex U.S. Index captures large and mid-cap representation across 22 of 23 Developed Markets (DM) countries (excluding the United States) and 24 Emerging Markets (EM) countries. The index covers approximately 85% of the global equity opportunity set outside the U.S. An investor cannot invest directly in an index. The volatility of the benchmark may be materially different from the individual performance obtained by a specific investor.
The Russell 2000 Index is a well-known, unmanaged index of the prices of 2000 small-cap company common stocks, selected by Russell. The Russell 2000 Index assumes reinvestment of dividends but does not reflect advisory fees. An investor cannot invest directly in an index. The volatility of the benchmark may be materially different from the individual performance obtained by a specific investor.
The S&P Mid Cap 400 provides investors with a benchmark for mid-sized companies. The index, which is distinct from the large-cap S&P 500, is designed to measure the performance of 400 mid-sized companies, reflecting the distinctive risk and return characteristics of this market segment.
The S&P 500 Pure Value index is a style-concentrated index designed to track the performance of stocks that exhibit the strongest value characteristics by using a style-attractiveness-weighting scheme. An investor cannot directly invest in an index. The volatility of the benchmark may be materially different from the individual performance obtained by a specific investor.