The fourth quarter 2022 earnings season has officially wrapped up, and the results were expectedly underwhelming. Total earnings were down -4.6% year-over-year, on +5.3% higher revenues, with about 70% of companies beating EPS and revenue estimates. The quick read here is that sales remained strong and pricing power likely helped boost revenues, but rising costs – particularly labor costs – crimped profits.1
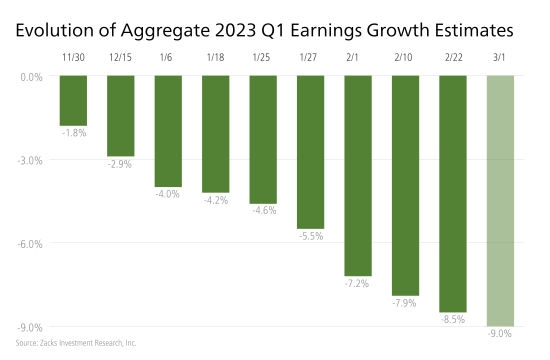
As has been the case since April 2022, earnings estimates have been coming down for future quarters. For full-year 2023, aggregate earnings estimates have been cut by -12.4% for the full index, and for Q1 2023, S&P 500 earnings are expected to decline -9.0% on +2.0% higher revenues, as seen in the chart below:
Investors may see this posted earnings decline, and expected earnings decline for Q1 2023, and think: doesn’t this make a case for being out of stocks now? If company earnings are expected to be weak and/or to fall, shouldn’t we wait until the earnings picture improves before committing to equities?
In my view, and using history as a guide, the answer is no.
If we take a look back at the cyclical and structural bear markets of this century – which is to say the 2000 – 2002 tech bubble and the 2007 – 2009 Global Financial Crisis, we find a similar pattern to what we saw in 2022.
When the tech bubble bear market started in March 2000, earnings were still positive, much as they were in 2022 when last year’s bear market commenced in January. Earnings did not officially turn negative until Q4 2000, several months after the bear market had begun. The takeaway here is one I make often – the stock market almost always prices in earnings weakness before it happens, not while it’s happening.
In 2007, the bear market associated with the Global Financial Crisis took hold in October. But it was not until March of the following year that EPS declines became official, another example of the stock market acting as a discounting mechanism for future economic and earnings conditions.
In keeping with this thinking, history also tells us that the stock market will start to rebound before the economy and corporate earnings are firmly in growth trends. In fact, bull markets typically start during a recession, and around 6-9 months before a trough in earnings. It’s also been true that stocks tend to perform best when growth is weak but improving, rather than when growth is strong but slowing.
Thinking about the current environment, we now know that 2022’s bear market started in January, which again was several months before earnings declines became official. The three worst performing sectors during the bear market last year were Communication Services, Technology, and Consumer Discretionary, which were also the sectors posting the biggest earnings declines in Q4 2022. The stock market can be pretty efficient.
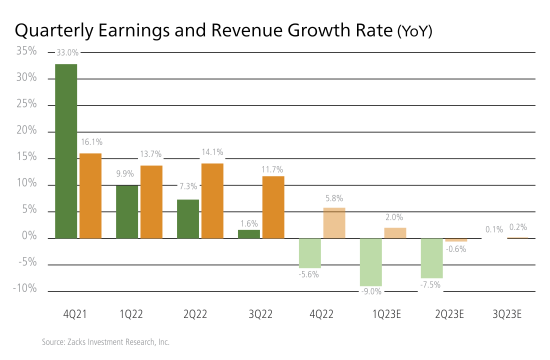
If we’re thinking about future stock market behavior, I would make the argument that we should focus on where corporate earnings will be in Q3 or Q4, not where they’ll be next quarter. Taking a look at Zacks Investment Research’s projections below, we’re seeing earnings rebound back into positive territory by Q3 2023 – fitting nicely with the 6–9-month timeline explained above.
Bottom Line for Investors
Many of the falling earnings estimates for coming quarters have factored in a recession. But recency bias often causes analysts and even CEOs to anticipate that a future recession will look like the last recession, which is rarely the case. If a recession in 2023 is mild, or even avoided altogether, earnings would be likely to exceed expectations – which markets like to see.
From an investment perspective, if we expect the U.S. economy to struggle in the first half of 2023 and to improve later in the year or even into 2024, it would make now the time to own stocks, in my view. And since corporate earnings estimates have already come down considerably, I’d be anticipating inflection points and opportunities for investors over the next few months.
Disclosure
2 Zacks. March 1, 2023. https://www.zacks.com/commentary/2060631/q4-earnings-season-is-winding-down-lets-see-whats-next
3 Zacks. March 1, 2023. https://www.zacks.com/commentary/2060631/q4-earnings-season-is-winding-down-lets-see-whats-next
DISCLOSURE
Past performance is no guarantee of future results. Inherent in any investment is the potential for loss.
Zacks Investment Management, Inc. is a wholly-owned subsidiary of Zacks Investment Research. Zacks Investment Management is an independent Registered Investment Advisory firm and acts as an investment manager for individuals and institutions. Zacks Investment Research is a provider of earnings data and other financial data to institutions and to individuals.
This material is being provided for informational purposes only and nothing herein constitutes investment, legal, accounting or tax advice, or a recommendation to buy, sell or hold a security. Do not act or rely upon the information and advice given in this publication without seeking the services of competent and professional legal, tax, or accounting counsel. Publication and distribution of this article is not intended to create, and the information contained herein does not constitute, an attorney-client relationship. No recommendation or advice is being given as to whether any investment or strategy is suitable for a particular investor. It should not be assumed that any investments in securities, companies, sectors or markets identified and described were or will be profitable. All information is current as of the date of herein and is subject to change without notice. Any views or opinions expressed may not reflect those of the firm as a whole.
Any projections, targets, or estimates in this report are forward looking statements and are based on the firm’s research, analysis, and assumptions. Due to rapidly changing market conditions and the complexity of investment decisions, supplemental information and other sources may be required to make informed investment decisions based on your individual investment objectives and suitability specifications. All expressions of opinions are subject to change without notice. Clients should seek financial advice regarding the appropriateness of investing in any security or investment strategy discussed in this presentation.
Certain economic and market information contained herein has been obtained from published sources prepared by other parties. Zacks Investment Management does not assume any responsibility for the accuracy or completeness of such information. Further, no third party has assumed responsibility for independently verifying the information contained herein and accordingly no such persons make any representations with respect to the accuracy, completeness or reasonableness of the information provided herein. Unless otherwise indicated, market analysis and conclusions are based upon opinions or assumptions that Zacks Investment Management considers to be reasonable. Any investment inherently involves a high degree of risk, beyond any specific risks discussed herein.
The S&P 500 Index is a well-known, unmanaged index of the prices of 500 large-company common stocks, mainly blue-chip stocks, selected by Standard & Poor’s. The S&P 500 Index assumes reinvestment of dividends but does not reflect advisory fees. The volatility of the benchmark may be materially different from the individual performance obtained by a specific investor. An investor cannot invest directly in an index.
The Russell 1000 Growth Index is a well-known, unmanaged index of the prices of 1000 large-company growth common stocks selected by Russell. The Russell 1000 Growth Index assumes reinvestment of dividends but does not reflect advisory fees. An investor cannot invest directly in an index. The volatility of the benchmark may be materially different from the individual performance obtained by a specific investor.
Nasdaq Composite Index is the market capitalization-weighted index of over 3,300 common equities listed on the Nasdaq stock exchange. The types of securities in the index include American depositary receipts, common stocks, real estate investment trusts (REITs) and tracking stocks, as well as limited partnership interests. The index includes all Nasdaq-listed stocks that are not derivatives, preferred shares, funds, exchange-traded funds (ETFs) or debenture securities. An investor cannot invest directly in an index. The volatility of the benchmark may be materially different from the individual performance obtained by a specific investor.
The Dow Jones Industrial Average measures the daily stock market movements of 30 U.S. publicly-traded companies listed on the NASDAQ or the New York Stock Exchange (NYSE). The 30 publicly-owned companies are considered leaders in the United States economy. An investor cannot directly invest in an index. The volatility of the benchmark may be materially different from the individual performance obtained by a specific investor.
The Bloomberg Global Aggregate Index is a flagship measure of global investment grade debt from twenty-four local currency markets. This multi-currency benchmark includes treasury, government-related, corporate and securitized fixed-rate bonds from both developed and emerging markets issuers. An investor cannot invest directly in an index. The volatility of the benchmark may be materially different from the individual performance obtained by a specific investor.
The ICE Exchange-Listed Fixed & Adjustable Rate Preferred Securities Index is a modified market capitalization weighted index composed of preferred stock and securities that are functionally equivalent to preferred stock including, but not limited to, depositary preferred securities, perpetual subordinated debt and certain securities issued by banks and other financial institutions that are eligible for capital treatment with respect to such instruments akin to that received for issuance of straight preferred stock. An investor cannot invest directly in an index. The volatility of the benchmark may be materially different from the individual performance obtained by a specific investor.
The MSCI ACWI ex U.S. Index captures large and mid-cap representation across 22 of 23 Developed Markets (DM) countries (excluding the United States) and 24 Emerging Markets (EM) countries. The index covers approximately 85% of the global equity opportunity set outside the U.S. An investor cannot invest directly in an index. The volatility of the benchmark may be materially different from the individual performance obtained by a specific investor.