In the first six months of 2023, CCC-rated junk bonds have been outperforming investment-grade corporate bonds (AA-rated) by a fairly wide margin. Junk bonds are up 10% year-to-date, compared to 2.7% for highly-rated bonds.1
One viable reason for the outperformance has been the U.S. economy’s resilience so far this year. Borrowers with weaker balance sheets are benefiting from the absence of a recession, which has given investors the ability to benefit from higher yields and a lower risk of default. It’s also meant that many upstart and ‘growth’ companies have been able to grow and service their existing debt without having to borrow more or refinance, which is crucial—especially since many of these less-creditworthy companies continue to benefit from low borrowing costs locked in during the era of near-zero interest rates.
But these favorable conditions may be changing soon.
For one, the Federal Reserve’s policy stance has shifted over the past few months. In March, a majority of Fed officials had projected that no additional rate increases would be needed in 2023. But stubborn inflation and ongoing strength in the economy and labor markets have shifted their thinking.
Consumer prices, as measured by the Fed’s preferred personal-consumption expenditures (PCE) price index, rose at a seasonally adjusted 3.8% annual rate in May, a meaningful improvement from the 7% peak rate reached in July 2022 but still well above the 2% target. Core prices, which exclude food and energy, registered at 4.6% in May, a slight improvement from April’s 4.7% print but again well above what the Fed wants.
PCE Price Index (Blue) and Core PCE Price Index (Red)
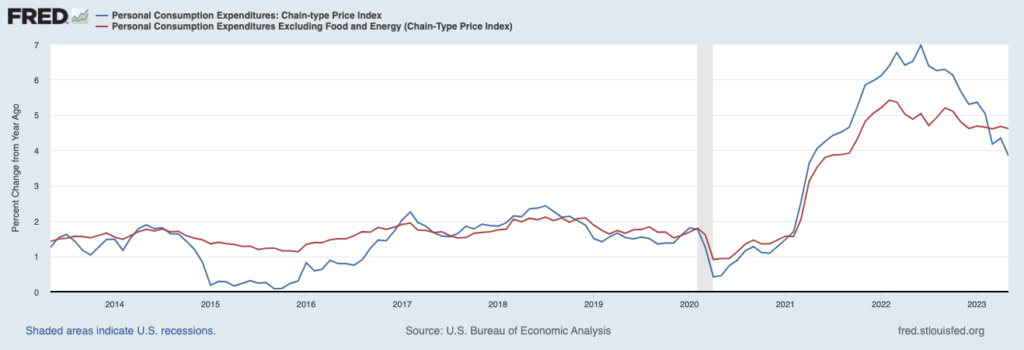
Source: Federal Reserve Bank of St. Louis2
Still elevated inflation continues to be pressured by the services sector, namely in housing where the impact of rising and falling rents work on a lag. Regardless of the cause, the Federal Reserve has responded by signaling that more hikes are likely in 2023. At the June meeting, the Fed released projections for the Fed funds rate for the remainder of 2023, and 12 of 18 officials indicated that rates would need to rise from 5.5% to 5.75% or even higher. These projections imply two or three more rate hikes in 2023, which is higher than just about anyone had expected for the year.
And that’s not good for the riskiest segments of corporate bond markets, in my view. Weak borrowers that were able to take advantage of ultralow interest rates are likely to encounter much higher rates when it comes time to refinance, which many will need to do. There appears to be some passivity to this issue in debt markets at the moment, mainly because most of the currently outstanding corporate bonds don’t start maturing until 2025 – which means there’s time for the Fed to shift its stance to cutting rates.
For its part, the market continues to price in the likelihood of recession, which means it’s also pricing in rate cuts sometime in the next year. Perhaps that’s why we haven’t seen much pressure in junk bond markets to date.
But as readers know, I think there is a distinct possibility the U.S. could avoid recession altogether, which would certainly complicate the interest rate picture for risky borrowers. If the Fed keeps rates “higher for longer” as a result of continued economic growth, refinancing will remain expensive. That’s not good for companies with weak free cash flow and high debt loads.
Bottom Line for Investors
Given recent outperformance in junk bonds, there appears to be some level of complacency when it comes to the outlook for interest rates, i.e., that they are set to fall in the next year or so.
But I would caution against that conclusion. If the U.S. economy continues to be resilient – which I see as a distinct possibility – it could mean ‘higher for longer’ interest rates, which I think would factor as a negative surprise for companies expecting a lower cost of borrowing and refinancing relative to where rates are today. For investors venturing out onto the risk curve of corporate debt, I think that means being very cautious around the riskier borrowers.
Disclosure
1 Wall Street Journal. July 5, 2023. https://www.wsj.com/articles/markets-ignore-the-looming-debt-peril-aac19b32
2 Fred Economic Data. June 30, 2023. https://fred.stlouisfed.org/series/PCEPI#
DISCLOSURE
Past performance is no guarantee of future results. Inherent in any investment is the potential for loss.
Zacks Investment Management, Inc. is a wholly-owned subsidiary of Zacks Investment Research. Zacks Investment Management is an independent Registered Investment Advisory firm and acts as an investment manager for individuals and institutions. Zacks Investment Research is a provider of earnings data and other financial data to institutions and to individuals.
This material is being provided for informational purposes only and nothing herein constitutes investment, legal, accounting or tax advice, or a recommendation to buy, sell or hold a security. Do not act or rely upon the information and advice given in this publication without seeking the services of competent and professional legal, tax, or accounting counsel. Publication and distribution of this article is not intended to create, and the information contained herein does not constitute, an attorney-client relationship. No recommendation or advice is being given as to whether any investment or strategy is suitable for a particular investor. It should not be assumed that any investments in securities, companies, sectors or markets identified and described were or will be profitable. All information is current as of the date of herein and is subject to change without notice. Any views or opinions expressed may not reflect those of the firm as a whole.
Any projections, targets, or estimates in this report are forward looking statements and are based on the firm’s research, analysis, and assumptions. Due to rapidly changing market conditions and the complexity of investment decisions, supplemental information and other sources may be required to make informed investment decisions based on your individual investment objectives and suitability specifications. All expressions of opinions are subject to change without notice. Clients should seek financial advice regarding the appropriateness of investing in any security or investment strategy discussed in this presentation.
Certain economic and market information contained herein has been obtained from published sources prepared by other parties. Zacks Investment Management does not assume any responsibility for the accuracy or completeness of such information. Further, no third party has assumed responsibility for independently verifying the information contained herein and accordingly no such persons make any representations with respect to the accuracy, completeness or reasonableness of the information provided herein. Unless otherwise indicated, market analysis and conclusions are based upon opinions or assumptions that Zacks Investment Management considers to be reasonable. Any investment inherently involves a high degree of risk, beyond any specific risks discussed herein.
The S&P 500 Index is a well-known, unmanaged index of the prices of 500 large-company common stocks, mainly blue-chip stocks, selected by Standard & Poor’s. The S&P 500 Index assumes reinvestment of dividends but does not reflect advisory fees. The volatility of the benchmark may be materially different from the individual performance obtained by a specific investor. An investor cannot invest directly in an index.
The Russell 1000 Growth Index is a well-known, unmanaged index of the prices of 1000 large-company growth common stocks selected by Russell. The Russell 1000 Growth Index assumes reinvestment of dividends but does not reflect advisory fees. An investor cannot invest directly in an index. The volatility of the benchmark may be materially different from the individual performance obtained by a specific investor.
Nasdaq Composite Index is the market capitalization-weighted index of over 3,300 common equities listed on the Nasdaq stock exchange. The types of securities in the index include American depositary receipts, common stocks, real estate investment trusts (REITs) and tracking stocks, as well as limited partnership interests. The index includes all Nasdaq-listed stocks that are not derivatives, preferred shares, funds, exchange-traded funds (ETFs) or debenture securities. An investor cannot invest directly in an index. The volatility of the benchmark may be materially different from the individual performance obtained by a specific investor.
The Dow Jones Industrial Average measures the daily stock market movements of 30 U.S. publicly-traded companies listed on the NASDAQ or the New York Stock Exchange (NYSE). The 30 publicly-owned companies are considered leaders in the United States economy. An investor cannot directly invest in an index. The volatility of the benchmark may be materially different from the individual performance obtained by a specific investor.
The Bloomberg Global Aggregate Index is a flagship measure of global investment grade debt from twenty-four local currency markets. This multi-currency benchmark includes treasury, government-related, corporate and securitized fixed-rate bonds from both developed and emerging markets issuers. An investor cannot invest directly in an index. The volatility of the benchmark may be materially different from the individual performance obtained by a specific investor.
The ICE Exchange-Listed Fixed & Adjustable Rate Preferred Securities Index is a modified market capitalization weighted index composed of preferred stock and securities that are functionally equivalent to preferred stock including, but not limited to, depositary preferred securities, perpetual subordinated debt and certain securities issued by banks and other financial institutions that are eligible for capital treatment with respect to such instruments akin to that received for issuance of straight preferred stock. An investor cannot invest directly in an index. The volatility of the benchmark may be materially different from the individual performance obtained by a specific investor.
The MSCI ACWI ex U.S. Index captures large and mid-cap representation across 22 of 23 Developed Markets (DM) countries (excluding the United States) and 24 Emerging Markets (EM) countries. The index covers approximately 85% of the global equity opportunity set outside the U.S. An investor cannot invest directly in an index. The volatility of the benchmark may be materially different from the individual performance obtained by a specific investor.
The Russell 2000 Index is a well-known, unmanaged index of the prices of 2000 small-cap company common stocks, selected by Russell. The Russell 2000 Index assumes reinvestment of dividends but does not reflect advisory fees. An investor cannot invest directly in an index. The volatility of the benchmark may be materially different from the individual performance obtained by a specific investor.
The S&P Mid Cap 400 provides investors with a benchmark for mid-sized companies. The index, which is distinct from the large-cap S&P 500, is designed to measure the performance of 400 mid-sized companies, reflecting the distinctive risk and return characteristics of this market segment.
The S&P 500 Pure Value index is a style-concentrated index designed to track the performance of stocks that exhibit the strongest value characteristics by using a style-attractiveness-weighting scheme. An investor cannot directly invest in an index. The volatility of the benchmark may be materially different from the individual performance obtained by a specific investor.