There’s a new inflation story every day, but that doesn’t mean investors are any closer to making sense of it all.
For one, the varying measures of inflation – and all of the categories and sub-categories that go along with it – are nothing short of head-spinning. Most readers have heard of the commonly cited Consumer Price Index (CPI), but that’s not even the measure of inflation the Federal Reserve uses when making policy decisions. The Fed focuses on the Personal Consumption Expenditures (PCE) price index, and these days the central bank also seems to prefer stripping out food, energy, goods, and shelter (housing).1
All told, the Atlanta Federal Reserve tracks nine inflation indices that all use slightly different methodologies to measure “underlying” inflation. As you can see below, the results often vary widely, painting significantly different inflation pictures depending on which metric is being used:
| Measure of Underlying Inflation | 12-Month Growth Rate (December 2022) |
| Core CPI | 5.7% |
| FRB Cleveland Median CPI | 6.9% |
| FRB Cleveland 16% Trimmed-Mean CPI | 6.5% |
| Atlanta Fed Sticky CPI | 6.7% |
| Core PCE | 4.7% |
| Market-Based Core PCE | 4.9% |
| FRB Dallas Trimmed-Mean PCE | 4.6% |
| FRB San Francisco Cyclical Core PCE Inflation | 7.5% |
| Cyclically Sensitive Inflation (Stock and Watson (2019)) | 6.7% |
In any given year, as an investor determines their outlook for inflation, interest rates, and corporate earnings, using CPI and Core CPI is likely satisfactory for the inflation piece of the analysis. But I’m not sure that works for 2023.
This year, I think investors should focus on what the Federal Reserve is focused on. Minutes from the December Fed meeting – in addition to numerous comments and press conferences from Chairman Jerome Powell – say the focus should be core services inflation excluding housing. In other words, while analysts and experts are breaking down changes to the prices of eggs, gas, and refrigerators each month, investors can likely look past these commentaries and data points. At this stage, “goods inflation” is not bearing nearly as much weight on the Fed’s thinking as many investors and market watchers may think.
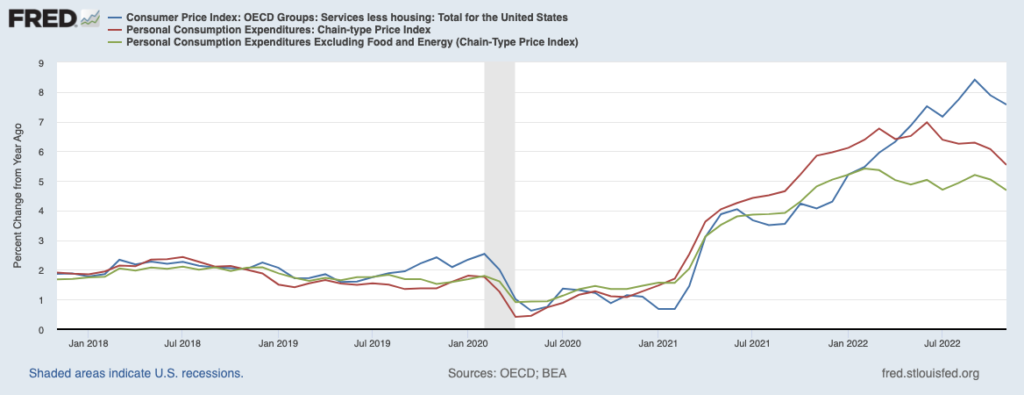
Last month, for instance, CPI fell to 6.5% in December from 7.1% in November and a peak of 9.1% in June, and overall consumer prices also fell -0.1% in December from November – the first monthly drop since May 2020. The Fed was largely unmoved. That’s because core services inflation (blue line on the chart below) remains elevated even as broad-based measures of inflation are in a downward trend.
Services Inflation Excluding Housing (Blue Line) Remains Elevated
Services inflation is driven in large part by a tight labor market’s effect on wages. That means investors’ approach to inflation this year should involve monitoring average hourly wage data, as well as keeping an eye on the Bureau of Labor Statistic’s employment cost index release. These are the inflation metrics the Fed is watching most closely to determine the path of interest rates, so it makes sense that investors should be honing-in on this aspect of inflation, too.
Bottom Line for Investors
December 2022 wage data was encouraging. Year-over-year, wages rose by 4.6%, a marked improvement from a 5.6% peak in March but still not compatible with the overarching goal of 2% core inflation. Looking at just Q4 2022, wages grew at a 4.1% annual rate, which may be confirmation that a softening trend is firmly underway.
Later in January, the Labor Department will release its quarterly employment-cost index, which is not likely to receive much press but that investors should keep a close eye on. The Fed sees this index as the most reliable gauge of worker pay, so it is likely to factor heavily into their plans for interest rate policy. Better data on wages could offer a clearer understanding of where interest rates will peak, which many would argue is what the stock market needs for a sustained rally.
Disclosure
2 Federal Reserve of Atlanta. 2023. https://www.atlantafed.org/research/inflationproject/underlying-inflation-dashboard
3 Fred Economic Data. January 13, 2023. https://fred.stlouisfed.org/series/USACPGRLH01IXOBM#
DISCLOSURE
Past performance is no guarantee of future results. Inherent in any investment is the potential for loss.
Zacks Investment Management, Inc. is a wholly-owned subsidiary of Zacks Investment Research. Zacks Investment Management is an independent Registered Investment Advisory firm and acts as an investment manager for individuals and institutions. Zacks Investment Research is a provider of earnings data and other financial data to institutions and to individuals.
This material is being provided for informational purposes only and nothing herein constitutes investment, legal, accounting or tax advice, or a recommendation to buy, sell or hold a security. Do not act or rely upon the information and advice given in this publication without seeking the services of competent and professional legal, tax, or accounting counsel. Publication and distribution of this article is not intended to create, and the information contained herein does not constitute, an attorney-client relationship. No recommendation or advice is being given as to whether any investment or strategy is suitable for a particular investor. It should not be assumed that any investments in securities, companies, sectors or markets identified and described were or will be profitable. All information is current as of the date of herein and is subject to change without notice. Any views or opinions expressed may not reflect those of the firm as a whole.
Any projections, targets, or estimates in this report are forward looking statements and are based on the firm’s research, analysis, and assumptions. Due to rapidly changing market conditions and the complexity of investment decisions, supplemental information and other sources may be required to make informed investment decisions based on your individual investment objectives and suitability specifications. All expressions of opinions are subject to change without notice. Clients should seek financial advice regarding the appropriateness of investing in any security or investment strategy discussed in this presentation.
Certain economic and market information contained herein has been obtained from published sources prepared by other parties. Zacks Investment Management does not assume any responsibility for the accuracy or completeness of such information. Further, no third party has assumed responsibility for independently verifying the information contained herein and accordingly no such persons make any representations with respect to the accuracy, completeness or reasonableness of the information provided herein. Unless otherwise indicated, market analysis and conclusions are based upon opinions or assumptions that Zacks Investment Management considers to be reasonable. Any investment inherently involves a high degree of risk, beyond any specific risks discussed herein.
The S&P 500 Index is a well-known, unmanaged index of the prices of 500 large-company common stocks, mainly blue-chip stocks, selected by Standard & Poor’s. The S&P 500 Index assumes reinvestment of dividends but does not reflect advisory fees. The volatility of the benchmark may be materially different from the individual performance obtained by a specific investor. An investor cannot invest directly in an index.
The Russell 1000 Growth Index is a well-known, unmanaged index of the prices of 1000 large-company growth common stocks selected by Russell. The Russell 1000 Growth Index assumes reinvestment of dividends but does not reflect advisory fees. An investor cannot invest directly in an index. The volatility of the benchmark may be materially different from the individual performance obtained by a specific investor.
Nasdaq Composite Index is the market capitalization-weighted index of over 3,300 common equities listed on the Nasdaq stock exchange. The types of securities in the index include American depositary receipts, common stocks, real estate investment trusts (REITs) and tracking stocks, as well as limited partnership interests. The index includes all Nasdaq-listed stocks that are not derivatives, preferred shares, funds, exchange-traded funds (ETFs) or debenture securities. An investor cannot invest directly in an index. The volatility of the benchmark may be materially different from the individual performance obtained by a specific investor.
The Dow Jones Industrial Average measures the daily stock market movements of 30 U.S. publicly-traded companies listed on the NASDAQ or the New York Stock Exchange (NYSE). The 30 publicly-owned companies are considered leaders in the United States economy. An investor cannot directly invest in an index. The volatility of the benchmark may be materially different from the individual performance obtained by a specific investor.
The Bloomberg Global Aggregate Index is a flagship measure of global investment grade debt from twenty-four local currency markets. This multi-currency benchmark includes treasury, government-related, corporate and securitized fixed-rate bonds from both developed and emerging markets issuers. An investor cannot invest directly in an index. The volatility of the benchmark may be materially different from the individual performance obtained by a specific investor.
The ICE Exchange-Listed Fixed & Adjustable Rate Preferred Securities Index is a modified market capitalization weighted index composed of preferred stock and securities that are functionally equivalent to preferred stock including, but not limited to, depositary preferred securities, perpetual subordinated debt and certain securities issued by banks and other financial institutions that are eligible for capital treatment with respect to such instruments akin to that received for issuance of straight preferred stock. An investor cannot invest directly in an index. The volatility of the benchmark may be materially different from the individual performance obtained by a specific investor.