The ‘Collapse’ of the 60/40 Portfolio
For a long time, a ‘balanced’ portfolio of 60% stocks and 40% bonds was a tried-and-true strategy for pursuing goals of growth and capital preservation at the same time. When stocks do well, the portfolio benefits from growth. And when stocks do poorly, bonds are expected to mitigate the downside and reduce volatility. Many investors follow the popular adage that ‘100 minus your age’ is how much you should allocate to stocks.
But these long-held beliefs have been challenged recently.
2022 was a difficult year for both stocks and bonds, which also meant weak returns for 60/40 portfolios. Performance varies based on categories of stocks and bonds in a portfolio, but I’d venture to say that most 60/40 portfolios probably declined in the neighborhood of -15% in 2022, which marked the worst performance for that allocation since at least 1937. And to make matters harder for 60/40 investors, while stocks have staged a recovery in 2023, bonds continue to underperform as interest rates have been pressured higher by stronger-than-expected economic growth.1
This dynamic has many investors wondering if the benefits of the 60/40 portfolio are gone for good.
But I wouldn’t be so quick to leap to that conclusion. For most of history, bonds have been effective at mitigating equity market risk, and they have also helped portfolios generate positive returns during periods when equities sold off sharply. When it mattered most – i.e., during the 2008 Global Financial Crisis – bond prices soared in the wake of the ‘flight to safety’ into U.S. Treasuries. During the past 20 years, there has been a consistently negative correlation between stocks and bonds, with basically the only exception being 2013’s “taper tantrum” when both declined in lockstep.
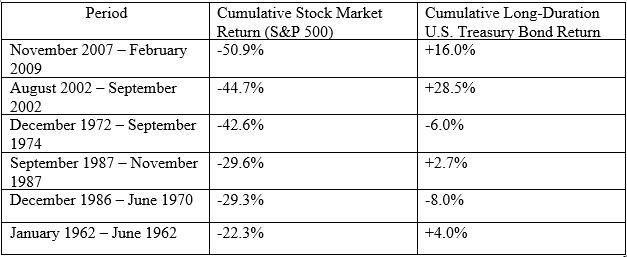
As readers can see in the table below, long-duration U.S. Treasury bonds have held up remarkably well – and almost always delivered positive performance – during the biggest equity market drawdowns. 2022 is arguably the exception, not the rule.
Now to be fair, there have also been several periods – sometimes long ones – where bonds and stocks were positively correlated. Those periods also happened to be ones where there was high inflation uncertainty, i.e., the 1970s and 1980s. Some have argued that an inflation rate of 2.5% is the point at which stocks and bonds flip in correlation from positive to negative or vice versa. During high inflation regimes, bonds suffer as coupon payments become less valuable and as investors demand higher yields, and stocks suffer from lower expected growth rates and cost pressures. High inflation can thus hurt both asset classes.
Expectations for higher-than-average inflation do not mean it’s time to abandon bonds in an investment portfolio, however. For one, inflation may continue to trend downward, and the Fed may find themselves in a situation where rate cuts make the most sense in 2024. That would likely benefit fixed-income performance.
Second, it’s important to remember that the fixed income portion of a portfolio can still serve all of the functions a long-term investor needs it to: generating cash flows, mitigating equity volatility risk, and preserving capital. This is especially true, in my view, when bonds in a portfolio are generally held to maturity (unless credit issues arise) and when duration is managed activity – both of which we do here at Zacks Investment Management.
Bottom Line for Investors
For the past couple of years, we have held a fairly cautious stance on fixed income as we anticipated rising rates, which led us to keep duration on the shorter end while focusing on higher credit quality bonds. Our decision-making also generated positive outcomes for our lower duration preferred stock portfolio, which mitigated the stock market’s downside effectively last year – with our Preferred strategy declining -10% compared to the benchmark’s -18% drop.
Looking ahead, yields are now in a place where investors can stay on the short end of the curve and still earn a positive real (inflation-adjusted) return, which is of course a break from the previous low-inflation low-interest rate regime when investors were starved for yield. For fixed-income assets held to maturity, the goals of preserving capital and generating cash flow are back on the table.
Disclosure
2 UBS. 2023. https://www.ubs.com/global/en/asset-management/global-sovereign-markets/overview/stock-bond-correlation.html
DISCLOSURE
Past performance is no guarantee of future results. Inherent in any investment is the potential for loss.
Zacks Investment Management, Inc. is a wholly-owned subsidiary of Zacks Investment Research. Zacks Investment Management is an independent Registered Investment Advisory firm and acts as an investment manager for individuals and institutions. Zacks Investment Research is a provider of earnings data and other financial data to institutions and to individuals.
This material is being provided for informational purposes only and nothing herein constitutes investment, legal, accounting or tax advice, or a recommendation to buy, sell or hold a security. Do not act or rely upon the information and advice given in this publication without seeking the services of competent and professional legal, tax, or accounting counsel. Publication and distribution of this article is not intended to create, and the information contained herein does not constitute, an attorney-client relationship. No recommendation or advice is being given as to whether any investment or strategy is suitable for a particular investor. It should not be assumed that any investments in securities, companies, sectors or markets identified and described were or will be profitable. All information is current as of the date of herein and is subject to change without notice. Any views or opinions expressed may not reflect those of the firm as a whole.
Any projections, targets, or estimates in this report are forward looking statements and are based on the firm’s research, analysis, and assumptions. Due to rapidly changing market conditions and the complexity of investment decisions, supplemental information and other sources may be required to make informed investment decisions based on your individual investment objectives and suitability specifications. All expressions of opinions are subject to change without notice. Clients should seek financial advice regarding the appropriateness of investing in any security or investment strategy discussed in this presentation.
Certain economic and market information contained herein has been obtained from published sources prepared by other parties. Zacks Investment Management does not assume any responsibility for the accuracy or completeness of such information. Further, no third party has assumed responsibility for independently verifying the information contained herein and accordingly no such persons make any representations with respect to the accuracy, completeness or reasonableness of the information provided herein. Unless otherwise indicated, market analysis and conclusions are based upon opinions or assumptions that Zacks Investment Management considers to be reasonable. Any investment inherently involves a high degree of risk, beyond any specific risks discussed herein.
The S&P 500 Index is a well-known, unmanaged index of the prices of 500 large-company common stocks, mainly blue-chip stocks, selected by Standard & Poor’s. The S&P 500 Index assumes reinvestment of dividends but does not reflect advisory fees. The volatility of the benchmark may be materially different from the individual performance obtained by a specific investor. An investor cannot invest directly in an index.
The Russell 1000 Growth Index is a well-known, unmanaged index of the prices of 1000 large-company growth common stocks selected by Russell. The Russell 1000 Growth Index assumes reinvestment of dividends but does not reflect advisory fees. An investor cannot invest directly in an index. The volatility of the benchmark may be materially different from the individual performance obtained by a specific investor.
Nasdaq Composite Index is the market capitalization-weighted index of over 3,300 common equities listed on the Nasdaq stock exchange. The types of securities in the index include American depositary receipts, common stocks, real estate investment trusts (REITs) and tracking stocks, as well as limited partnership interests. The index includes all Nasdaq-listed stocks that are not derivatives, preferred shares, funds, exchange-traded funds (ETFs) or debenture securities. An investor cannot invest directly in an index. The volatility of the benchmark may be materially different from the individual performance obtained by a specific investor.
The Dow Jones Industrial Average measures the daily stock market movements of 30 U.S. publicly-traded companies listed on the NASDAQ or the New York Stock Exchange (NYSE). The 30 publicly-owned companies are considered leaders in the United States economy. An investor cannot directly invest in an index. The volatility of the benchmark may be materially different from the individual performance obtained by a specific investor.
The Bloomberg Global Aggregate Index is a flagship measure of global investment grade debt from twenty-four local currency markets. This multi-currency benchmark includes treasury, government-related, corporate and securitized fixed-rate bonds from both developed and emerging markets issuers. An investor cannot invest directly in an index. The volatility of the benchmark may be materially different from the individual performance obtained by a specific investor.
The ICE Exchange-Listed Fixed & Adjustable Rate Preferred Securities Index is a modified market capitalization weighted index composed of preferred stock and securities that are functionally equivalent to preferred stock including, but not limited to, depositary preferred securities, perpetual subordinated debt and certain securities issued by banks and other financial institutions that are eligible for capital treatment with respect to such instruments akin to that received for issuance of straight preferred stock. An investor cannot invest directly in an index. The volatility of the benchmark may be materially different from the individual performance obtained by a specific investor.
The MSCI ACWI ex U.S. Index captures large and mid-cap representation across 22 of 23 Developed Markets (DM) countries (excluding the United States) and 24 Emerging Markets (EM) countries. The index covers approximately 85% of the global equity opportunity set outside the U.S. An investor cannot invest directly in an index. The volatility of the benchmark may be materially different from the individual performance obtained by a specific investor.
The Russell 2000 Index is a well-known, unmanaged index of the prices of 2000 small-cap company common stocks, selected by Russell. The Russell 2000 Index assumes reinvestment of dividends but does not reflect advisory fees. An investor cannot invest directly in an index. The volatility of the benchmark may be materially different from the individual performance obtained by a specific investor.
The S&P Mid Cap 400 provides investors with a benchmark for mid-sized companies. The index, which is distinct from the large-cap S&P 500, is designed to measure the performance of 400 mid-sized companies, reflecting the distinctive risk and return characteristics of this market segment.
The S&P 500 Pure Value index is a style-concentrated index designed to track the performance of stocks that exhibit the strongest value characteristics by using a style-attractiveness-weighting scheme. An investor cannot directly invest in an index. The volatility of the benchmark may be materially different from the individual performance obtained by a specific investor.