Are Ballooning Deficits a Problem for the Economy and Markets?
Rising deficits have been a major story in the headlines recently, and for good reason. According to the Congressional Budget Office, the gap between spending and revenue was $1.7 trillion in fiscal year 2023, which means the deficit grew by $300 billion year-over-year—even as the economy was expanding.1
Federal budget deficits keep growing
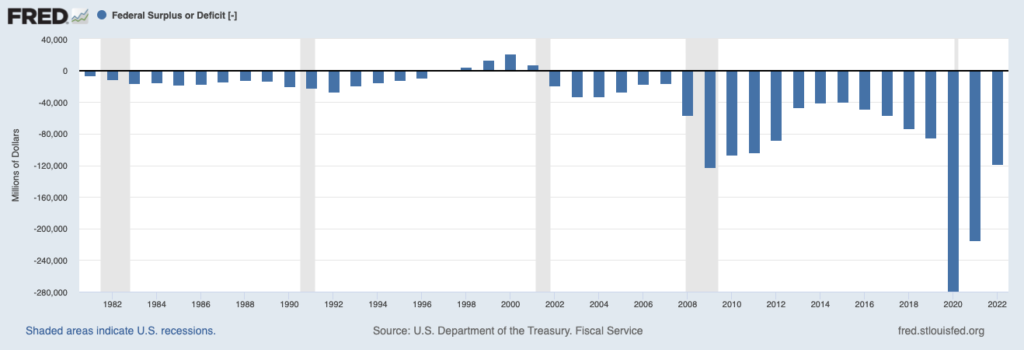
The on-again off-again student debt cancellation program resulted in some distortions to deficit calculations. In 2022, student debt cancellations resulted in a $300+ billion addition to the deficit, but following the Supreme Court decision that ruled the program unconstitutional, Treasury accounted for those dollars as a spending cut in 2023. Even still, accounting for these quirks, the federal deficit was more than 7% of GDP in fiscal 2023. Rarely do we see deficits this large during an economic expansion.
Without legislation to curb spending or raise revenues, some estimates show U.S. debt rising from 96% to 123% of GDP over the next 10 years. Nearly all of the increase would be driven by the primary deficit.
Last week, I argued that stronger-than-expected economic growth was putting upward pressure on interest rates, but I also cited growing deficits as a factor to monitor. The U.S. Treasury Department announced over the summer that it would gradually increase the size of its debt auctions to account for the increased spending, which led to some jitters over whether the market could absorb all of the new debt without demanding higher interest rates.
As I wrote last week, the latest Treasury bond auctions show that the market is indeed absorbing new issuance with little issue, and foreign holdings of U.S. debt are up over $500 billion since October 2022 and approaching an all-time high. It may not be a major issue now, but if deficits only continue to rise from here, debt issuance will need to go up too—and the market’s appetite for U.S. Treasury bonds isn’t infinite. Rates would need to go up, too.
For now, it’s important to scale the deficit issue and think about it in relative terms when considering the economic and market impact. To do that, the key data point to hone in on is how much the U.S. government is paying for its debt, i.e., interest costs as a percent of GDP. Interest payments – looked at in a vacuum – point to ballooning costs, with Treasury spending $711 billion in interest payments in 2023 compared to $177 billion in 2022. Higher rates are playing a central role, and the issue could get costlier going forward as more than half of government debt matures in less than three years. If rates stay elevated, this debt will become significantly more expensive.
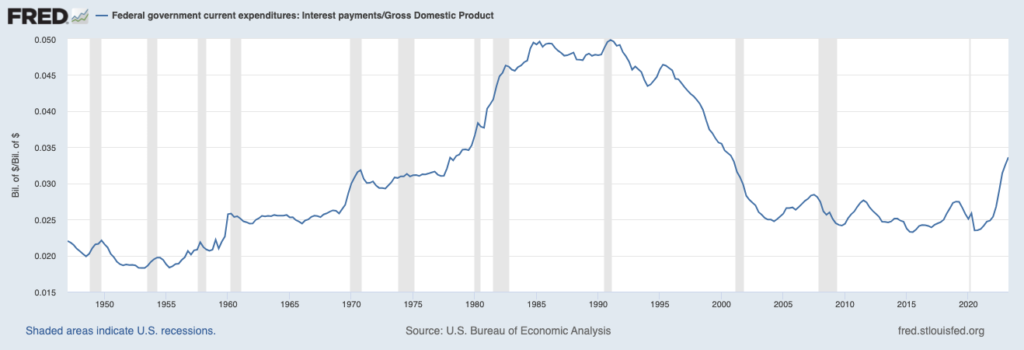
If we look at interest payments as a percent of GDP, however, the situation looks a bit less alarming. As seen in the chart below, high rates in the late 1970s and early 1980s pushed interest costs as a percent of GDP to levels much higher than we’re seeing today, and the U.S. economy managed to work its way through it—though not without some turbulence along the way.
Federal debt interest payments as a percent of GDP
Bottom Line for Investors
The upshot looking forward is that higher interest costs on U.S. debt could result in a greater appetite for fiscal tightening. Ongoing congressional gridlock and an upcoming presidential election may not make deficit reduction legislation likely in the coming year, but history suggests Congress may soon view it as an economic imperative. The elevated interest expenses cited above in the chart led to several rounds of deficit reduction legislation in the mid-1980s and in the years following, which ultimately resulted in a budget surplus in the mid-1990s. A key motivation for deficit reduction during that period was that ballooning interest payments were “crowding out” other more productive—or at least more popular—areas of spending. We could see this scenario play out again soon.
No administration wants to accept the reality that spending needs to go down and taxes need to go up, or at least economic growth needs to accelerate swiftly (which would result in higher tax revenues) without additional deficit spending. However, recent history suggests the market will respond accordingly if fiscal policy heads in the wrong direction. Last fall, a new government in the U.K. proposed a tax cut amid rising spending and inflation, and British bond yields surged immediately. The proposal was scrapped within a few days.
Disclosure
2 Fred Economic Data. September 13, 2023. https://fred.stlouisfed.org/series/MTSDS133FMS#
3 Fred Economic Data. September 28, 2023. https://fred.stlouisfed.org/series/A091RC1Q027SBEA#
DISCLOSURE
Past performance is no guarantee of future results. Inherent in any investment is the potential for loss.
Zacks Investment Management, Inc. is a wholly-owned subsidiary of Zacks Investment Research. Zacks Investment Management is an independent Registered Investment Advisory firm and acts as an investment manager for individuals and institutions. Zacks Investment Research is a provider of earnings data and other financial data to institutions and to individuals.
This material is being provided for informational purposes only and nothing herein constitutes investment, legal, accounting or tax advice, or a recommendation to buy, sell or hold a security. Do not act or rely upon the information and advice given in this publication without seeking the services of competent and professional legal, tax, or accounting counsel. Publication and distribution of this article is not intended to create, and the information contained herein does not constitute, an attorney-client relationship. No recommendation or advice is being given as to whether any investment or strategy is suitable for a particular investor. It should not be assumed that any investments in securities, companies, sectors or markets identified and described were or will be profitable. All information is current as of the date of herein and is subject to change without notice. Any views or opinions expressed may not reflect those of the firm as a whole.
Any projections, targets, or estimates in this report are forward looking statements and are based on the firm’s research, analysis, and assumptions. Due to rapidly changing market conditions and the complexity of investment decisions, supplemental information and other sources may be required to make informed investment decisions based on your individual investment objectives and suitability specifications. All expressions of opinions are subject to change without notice. Clients should seek financial advice regarding the appropriateness of investing in any security or investment strategy discussed in this presentation.
Certain economic and market information contained herein has been obtained from published sources prepared by other parties. Zacks Investment Management does not assume any responsibility for the accuracy or completeness of such information. Further, no third party has assumed responsibility for independently verifying the information contained herein and accordingly no such persons make any representations with respect to the accuracy, completeness or reasonableness of the information provided herein. Unless otherwise indicated, market analysis and conclusions are based upon opinions or assumptions that Zacks Investment Management considers to be reasonable. Any investment inherently involves a high degree of risk, beyond any specific risks discussed herein.
The S&P 500 Index is a well-known, unmanaged index of the prices of 500 large-company common stocks, mainly blue-chip stocks, selected by Standard & Poor’s. The S&P 500 Index assumes reinvestment of dividends but does not reflect advisory fees. The volatility of the benchmark may be materially different from the individual performance obtained by a specific investor. An investor cannot invest directly in an index.
The Russell 1000 Growth Index is a well-known, unmanaged index of the prices of 1000 large-company growth common stocks selected by Russell. The Russell 1000 Growth Index assumes reinvestment of dividends but does not reflect advisory fees. An investor cannot invest directly in an index. The volatility of the benchmark may be materially different from the individual performance obtained by a specific investor.
Nasdaq Composite Index is the market capitalization-weighted index of over 3,300 common equities listed on the Nasdaq stock exchange. The types of securities in the index include American depositary receipts, common stocks, real estate investment trusts (REITs) and tracking stocks, as well as limited partnership interests. The index includes all Nasdaq-listed stocks that are not derivatives, preferred shares, funds, exchange-traded funds (ETFs) or debenture securities. An investor cannot invest directly in an index. The volatility of the benchmark may be materially different from the individual performance obtained by a specific investor.
The Dow Jones Industrial Average measures the daily stock market movements of 30 U.S. publicly-traded companies listed on the NASDAQ or the New York Stock Exchange (NYSE). The 30 publicly-owned companies are considered leaders in the United States economy. An investor cannot directly invest in an index. The volatility of the benchmark may be materially different from the individual performance obtained by a specific investor.
The Bloomberg Global Aggregate Index is a flagship measure of global investment grade debt from twenty-four local currency markets. This multi-currency benchmark includes treasury, government-related, corporate and securitized fixed-rate bonds from both developed and emerging markets issuers. An investor cannot invest directly in an index. The volatility of the benchmark may be materially different from the individual performance obtained by a specific investor.
The ICE Exchange-Listed Fixed & Adjustable Rate Preferred Securities Index is a modified market capitalization weighted index composed of preferred stock and securities that are functionally equivalent to preferred stock including, but not limited to, depositary preferred securities, perpetual subordinated debt and certain securities issued by banks and other financial institutions that are eligible for capital treatment with respect to such instruments akin to that received for issuance of straight preferred stock. An investor cannot invest directly in an index. The volatility of the benchmark may be materially different from the individual performance obtained by a specific investor.
The MSCI ACWI ex U.S. Index captures large and mid-cap representation across 22 of 23 Developed Markets (DM) countries (excluding the United States) and 24 Emerging Markets (EM) countries. The index covers approximately 85% of the global equity opportunity set outside the U.S. An investor cannot invest directly in an index. The volatility of the benchmark may be materially different from the individual performance obtained by a specific investor.
The Russell 2000 Index is a well-known, unmanaged index of the prices of 2000 small-cap company common stocks, selected by Russell. The Russell 2000 Index assumes reinvestment of dividends but does not reflect advisory fees. An investor cannot invest directly in an index. The volatility of the benchmark may be materially different from the individual performance obtained by a specific investor.
The S&P Mid Cap 400 provides investors with a benchmark for mid-sized companies. The index, which is distinct from the large-cap S&P 500, is designed to measure the performance of 400 mid-sized companies, reflecting the distinctive risk and return characteristics of this market segment.
The S&P 500 Pure Value index is a style-concentrated index designed to track the performance of stocks that exhibit the strongest value characteristics by using a style-attractiveness-weighting scheme. An investor cannot directly invest in an index. The volatility of the benchmark may be materially different from the individual performance obtained by a specific investor.