Stocks Flirt with Correction Territory – Should You Be Concerned?
Equity investors cheered the first half of the year. Stocks rallied hard off the bear market bottom, even rising through regional bank failures and what many feared was another financial crisis.
But the good times came to an end on July 31.1
In the August, September, and October stretch, stocks declined rather sharply and with little respite, with the S&P 500 falling -9.9% through last Friday and the Nasdaq falling even further. Since a correction is technically defined as a sharp decline between -10% and -20%, the S&P 500 did not technically enter a correction. But it’s close enough.
This downdraft came before the S&P 500 managed to eclipse its 2021 all-time high, and it was also accompanied by a big upward move in long-duration bond yields and more recently, the breakout of war in the Middle East. Many investors are stepping back and questioning the veracity of this bull market.
I’ll touch on the interest rate and geopolitical issues more below. But the first point to make here is to remind readers that short, sharp declines in the stock market are very common. Since 1980, the average intra-year decline for the S&P 500 is -14.3%, signaling of course that downside volatility is not an anomaly—but a feature—of equity investing. During the 2009 to 2020 bull market, for instance, there were a total of nine corrections. Said another way, there were nine scary, sharp declines amid one of the strongest bull markets in history. It’s normal.
An example from history that somewhat resembles what we’re seeing today happened in March 2003, which was a correction very early on in the post-tech bubble bull market. Then, as now, investors feared the potential implications of a war in the Middle East, and perhaps other nations in the region. I don’t want to discount the possibility that the war expands into more of a regional or even global conflict, which could be bearish for markets and should be watched closely. But for now, I think the impact on the U.S. and global economy will be modest if not negligible.
On the matter of higher interest rates, I’ve written quite a bit recently about my view that stronger-than-expected economic growth is the main factor pressuring them higher. The very strong Q3 US GDP reading is evidence of this occurring.
Embedded in this view is the idea that strong growth is not ultimately a negative for markets, it’s a positive. Some investors may challenge this view by saying that stronger growth only means rates will continue to move higher, and stay higher for longer. That’s fair, but it’s also true that since 1962 – when data on 10-year constant maturity yield starts – over 50% of trading days featured rates higher than 5% (see chart below). There were bull and bear markets in this stretch, but stocks overwhelmingly rose.
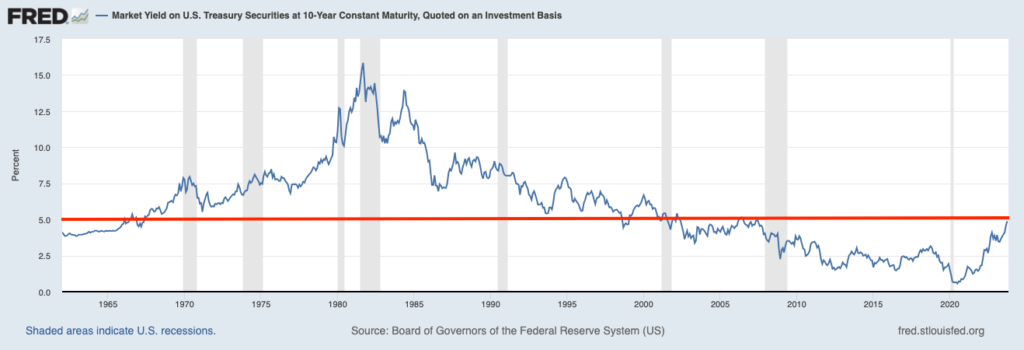
The 5% 10-year Treasury bond yield seems to be a matter of focus for the media currently, as though it’s a threshold that is make-or-break for stocks. But again, as seen on the chart above, rates were above 5% (the red line) from mid-1967 almost through 1998. In that time, stocks rose over +3,000%.
The issue that often troubles many investors – and ultimately hurts them – is that they let volatility increase their temptation to “time the market,” allowing short-term uncertainties to drive their decision-making. But it’s important to remember that volatility works both ways. Rapid declines are often followed by rapid recoveries. One may be starting now.
When an investor gets caught up in the negative news stories and sells into the downside of a correction, it often means capturing the losses but failing to participate in the recovery, which is a recipe for sub-optimal returns over time. Famed mutual fund manager Peter Lynch once quipped that “far more money has been lost by investors preparing for corrections, or trying to anticipate corrections, than has been lost in corrections themselves.”3
Bottom Line for Investors
When the market takes a sudden and sharp turn, investors often get rattled and start questioning their asset allocation. Getting worried and second-guessing is a normal, natural, and understandable response. Volatility can serve as an opportunity to review your asset allocation and make sure your portfolio is diversified and aligned with your long-term goals.
But if you’re feeling the urge to react and ‘do something about it,’ I’d strongly urge you to reconsider. If your goals have not significantly changed in the last few months, then in all likelihood, your investment portfolio shouldn’t change either.
Disclosure
2 Fred Economic Data. October 30, 2023. https://fred.stlouisfed.org/series/DGS10#
3 Acumen Wealth. April 8, 2018. https://acumenwealth.com/acumen-wealth-advisors-q1-2018-market-insights-commentary/
DISCLOSURE
Past performance is no guarantee of future results. Inherent in any investment is the potential for loss.
Zacks Investment Management, Inc. is a wholly-owned subsidiary of Zacks Investment Research. Zacks Investment Management is an independent Registered Investment Advisory firm and acts as an investment manager for individuals and institutions. Zacks Investment Research is a provider of earnings data and other financial data to institutions and to individuals.
This material is being provided for informational purposes only and nothing herein constitutes investment, legal, accounting or tax advice, or a recommendation to buy, sell or hold a security. Do not act or rely upon the information and advice given in this publication without seeking the services of competent and professional legal, tax, or accounting counsel. Publication and distribution of this article is not intended to create, and the information contained herein does not constitute, an attorney-client relationship. No recommendation or advice is being given as to whether any investment or strategy is suitable for a particular investor. It should not be assumed that any investments in securities, companies, sectors or markets identified and described were or will be profitable. All information is current as of the date of herein and is subject to change without notice. Any views or opinions expressed may not reflect those of the firm as a whole.
Any projections, targets, or estimates in this report are forward looking statements and are based on the firm’s research, analysis, and assumptions. Due to rapidly changing market conditions and the complexity of investment decisions, supplemental information and other sources may be required to make informed investment decisions based on your individual investment objectives and suitability specifications. All expressions of opinions are subject to change without notice. Clients should seek financial advice regarding the appropriateness of investing in any security or investment strategy discussed in this presentation.
Certain economic and market information contained herein has been obtained from published sources prepared by other parties. Zacks Investment Management does not assume any responsibility for the accuracy or completeness of such information. Further, no third party has assumed responsibility for independently verifying the information contained herein and accordingly no such persons make any representations with respect to the accuracy, completeness or reasonableness of the information provided herein. Unless otherwise indicated, market analysis and conclusions are based upon opinions or assumptions that Zacks Investment Management considers to be reasonable. Any investment inherently involves a high degree of risk, beyond any specific risks discussed herein.
The S&P 500 Index is a well-known, unmanaged index of the prices of 500 large-company common stocks, mainly blue-chip stocks, selected by Standard & Poor’s. The S&P 500 Index assumes reinvestment of dividends but does not reflect advisory fees. The volatility of the benchmark may be materially different from the individual performance obtained by a specific investor. An investor cannot invest directly in an index.
The Russell 1000 Growth Index is a well-known, unmanaged index of the prices of 1000 large-company growth common stocks selected by Russell. The Russell 1000 Growth Index assumes reinvestment of dividends but does not reflect advisory fees. An investor cannot invest directly in an index. The volatility of the benchmark may be materially different from the individual performance obtained by a specific investor.
Nasdaq Composite Index is the market capitalization-weighted index of over 3,300 common equities listed on the Nasdaq stock exchange. The types of securities in the index include American depositary receipts, common stocks, real estate investment trusts (REITs) and tracking stocks, as well as limited partnership interests. The index includes all Nasdaq-listed stocks that are not derivatives, preferred shares, funds, exchange-traded funds (ETFs) or debenture securities. An investor cannot invest directly in an index. The volatility of the benchmark may be materially different from the individual performance obtained by a specific investor.
The Dow Jones Industrial Average measures the daily stock market movements of 30 U.S. publicly-traded companies listed on the NASDAQ or the New York Stock Exchange (NYSE). The 30 publicly-owned companies are considered leaders in the United States economy. An investor cannot directly invest in an index. The volatility of the benchmark may be materially different from the individual performance obtained by a specific investor.
The Bloomberg Global Aggregate Index is a flagship measure of global investment grade debt from twenty-four local currency markets. This multi-currency benchmark includes treasury, government-related, corporate and securitized fixed-rate bonds from both developed and emerging markets issuers. An investor cannot invest directly in an index. The volatility of the benchmark may be materially different from the individual performance obtained by a specific investor.
The ICE Exchange-Listed Fixed & Adjustable Rate Preferred Securities Index is a modified market capitalization weighted index composed of preferred stock and securities that are functionally equivalent to preferred stock including, but not limited to, depositary preferred securities, perpetual subordinated debt and certain securities issued by banks and other financial institutions that are eligible for capital treatment with respect to such instruments akin to that received for issuance of straight preferred stock. An investor cannot invest directly in an index. The volatility of the benchmark may be materially different from the individual performance obtained by a specific investor.
The MSCI ACWI ex U.S. Index captures large and mid-cap representation across 22 of 23 Developed Markets (DM) countries (excluding the United States) and 24 Emerging Markets (EM) countries. The index covers approximately 85% of the global equity opportunity set outside the U.S. An investor cannot invest directly in an index. The volatility of the benchmark may be materially different from the individual performance obtained by a specific investor.
The Russell 2000 Index is a well-known, unmanaged index of the prices of 2000 small-cap company common stocks, selected by Russell. The Russell 2000 Index assumes reinvestment of dividends but does not reflect advisory fees. An investor cannot invest directly in an index. The volatility of the benchmark may be materially different from the individual performance obtained by a specific investor.
The S&P Mid Cap 400 provides investors with a benchmark for mid-sized companies. The index, which is distinct from the large-cap S&P 500, is designed to measure the performance of 400 mid-sized companies, reflecting the distinctive risk and return characteristics of this market segment.
The S&P 500 Pure Value index is a style-concentrated index designed to track the performance of stocks that exhibit the strongest value characteristics by using a style-attractiveness-weighting scheme. An investor cannot directly invest in an index. The volatility of the benchmark may be materially different from the individual performance obtained by a specific investor.