The chart below makes it clear – on a relative basis, that we are in a period of very low volatility. The chart below also makes it clear that low volatility is not necessarily unusual. It happens in cycles, and it is not necessarily unusual to see a period of low volatility and strong positive returns, as we are seeing now. Investors enjoyed similar conditions from 1992-1997 and from 2004-2007, as well as numerous other times throughout history.
But while investors may find comfort and increased optimism when volatility is low and returns are high, we at Zacks Investment Management tend to feel just the opposite. The market likes to revert in a variety of ways, and there is a tendency for periods of low volatility and strong returns to be followed by high volatility and low returns. The chart below offers visual evidence of this being the case.
Volatility as Measured by the CBOE VIX Index
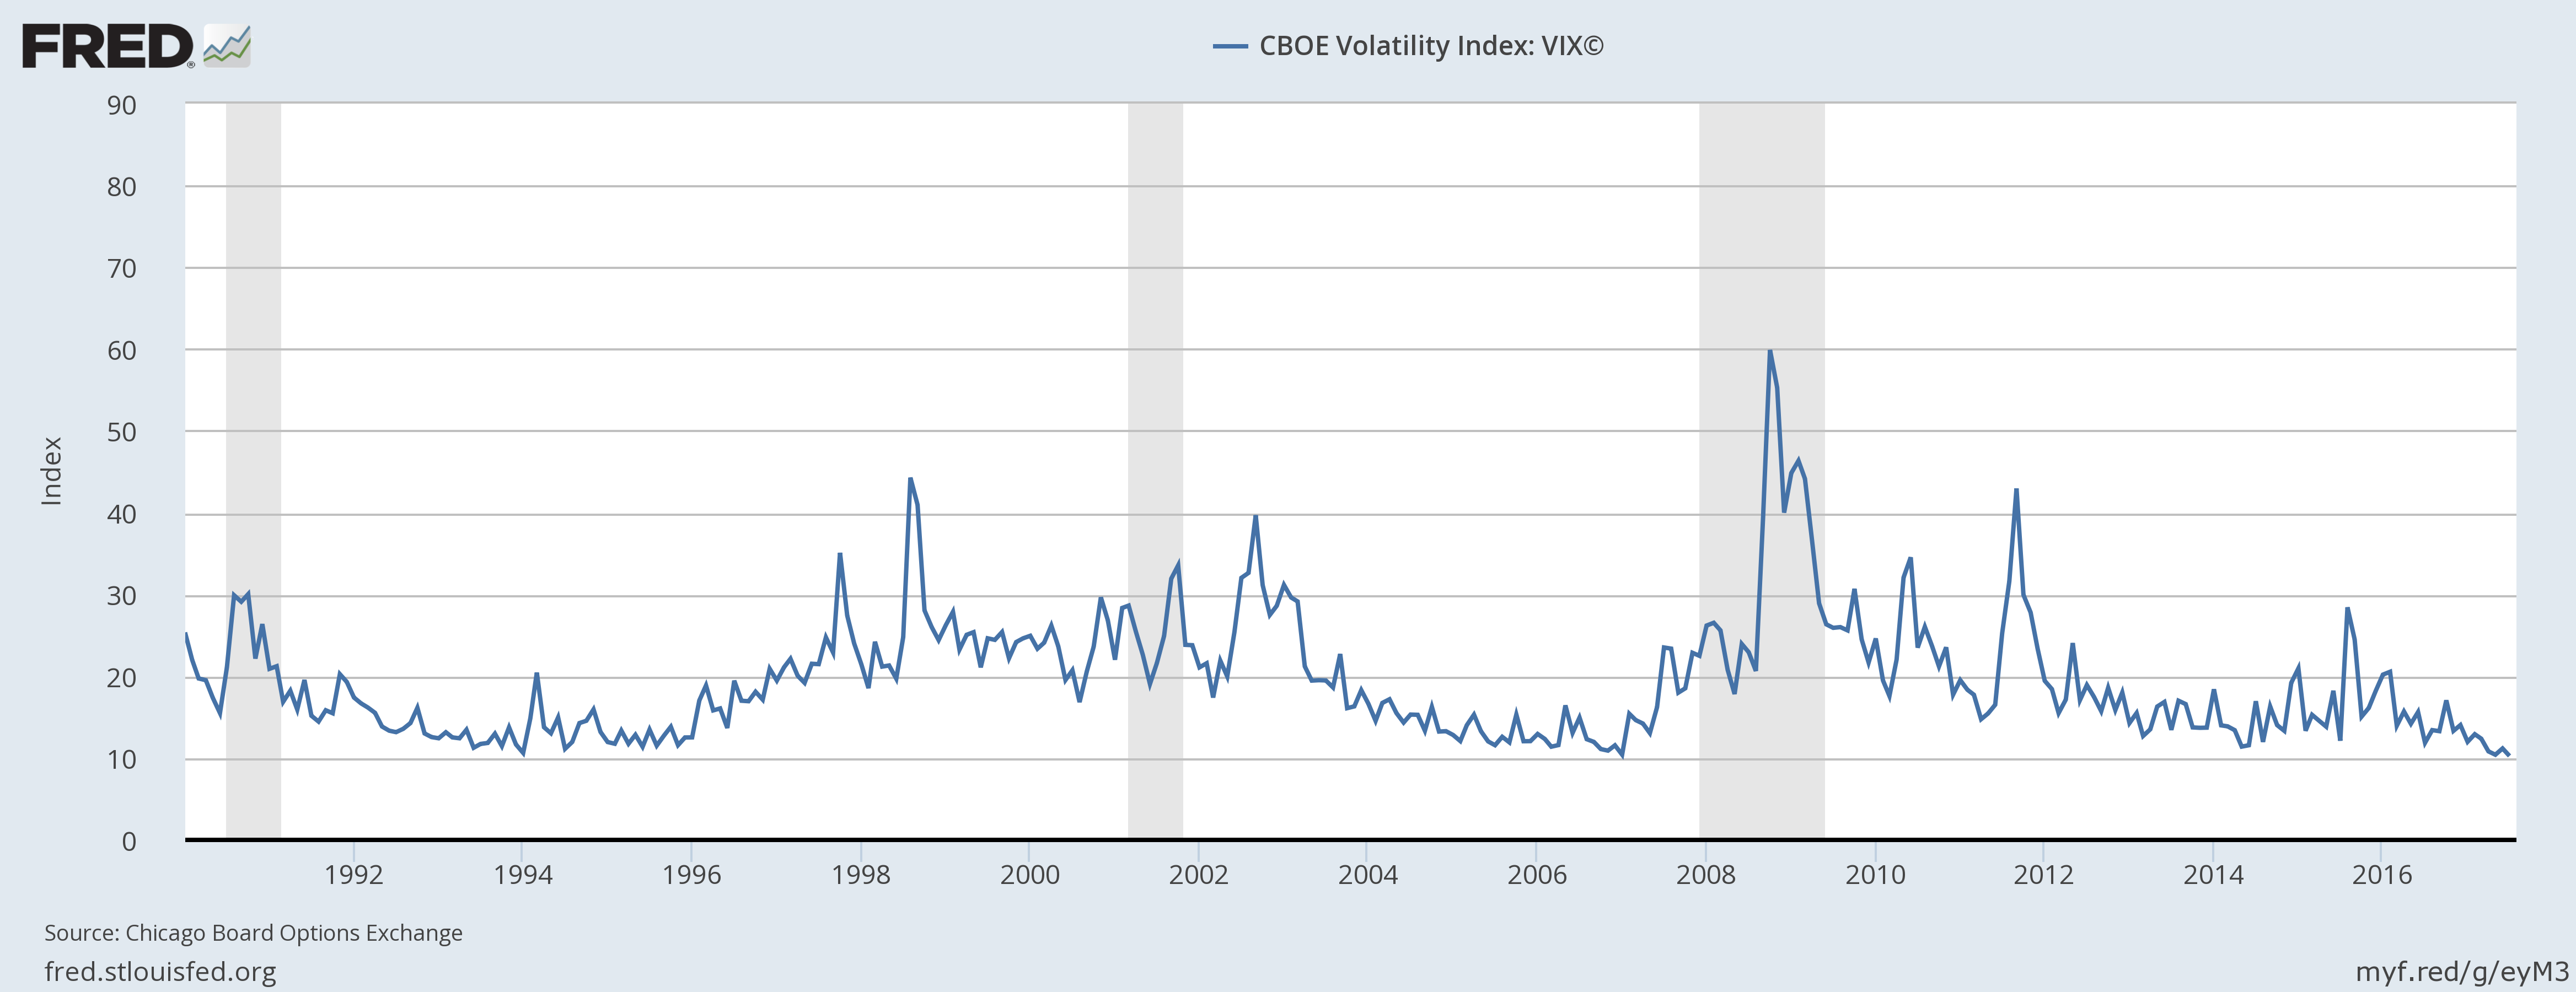
One plausible explanation for why volatility tends to move in cycles is complacency. During periods of low volatility, investors tend to get comfortable with the risks associated with equity investing. Often times, this complacency results in miscalculating or underestimating risk or just ignoring it altogether. Perhaps the most obvious example of this mistake can be found during the late 1990’s, eventually culminating with the technology bubble. During that time, investors became so optimistic with what seemed to be endless returns with little or no risk, that eventually that optimism/complacency gave way to risk-taking that well exceeded the norm. Excessive risk-taking led to outrageous valuations, which in turn collapsed the market.
The lesson we can garner from periods of low volatility and rising complacency – which I think we are starting to see today – is that when markets are calm for too long, risks have a tendency to build-up in the system without many people noticing, which sets the stage for sometimes massive market dislocations. The lull of volatility from 2004-2007 may have been one of those cases where low volatility prevented many from seeing the leverage and risk-taking happening in the derivatives markets.
So, what does this all say about the current environment?
I think it is sending us a “watchlist” signal, but not an outright flashing-red-warning signal. The fact that technology stocks, for instance, have been trading with the implied volatility below that of utility stocks is fairly odd. Technology stocks have some of the most volatile earnings of any sector out there, yet they are trading with less volatility than companies that steadily sell electricity? It does not make much sense, and to me, it stinks of complacency building up in the technology sector. Earnings in the tech space are still solid in many cases, but it warrants increased selectivity in my view.
Rising valuations are also a sign of complacency, and while we again are not at severe levels I do believe it is important that earnings do some catching-up in 2017. The S&P 500 trades at around 17.5x forward earnings as of the end of Q2, which is fair but ‘getting up there.’ The good news here is that we expect earnings growth to approach double digits for the full year of 2017, which should provide some relief. Any more multiple expansion from here could be a sign of complacency starting to cloud the risk narrative, with investors paying too much for expected forward returns. It’s a factor to watch closely from here.
The Bottom Line for Investors
The overarching takeaway here is that history shows volatility reverting – when it’s low, it is not likely to stay that way for long. That means investors should be bracing in some way for increased volatility ahead, which to me means ensuring that your portfolio is diversified across asset classes, style, size, and region in such a way that meets your long-term goals and has you invested sufficiently in non-correlated assets. If you are unsure today whether your portfolio meets all of this criterion, please do not hesitate to contact a Zacks Investment Advisor today for a free portfolio review at 1-888-600-2783. We can discuss your goals and objectives, analyze your current investment portfolio, and make recommendations for how we think your asset allocation can improve.
Disclosure
DISCLOSURE
Past performance is no guarantee of future results. Inherent in any investment is the potential for loss.
Zacks Investment Management, Inc. is a wholly-owned subsidiary of Zacks Investment Research. Zacks Investment Management is an independent Registered Investment Advisory firm and acts as an investment manager for individuals and institutions. Zacks Investment Research is a provider of earnings data and other financial data to institutions and to individuals.
This material is being provided for informational purposes only and nothing herein constitutes investment, legal, accounting or tax advice, or a recommendation to buy, sell or hold a security. Do not act or rely upon the information and advice given in this publication without seeking the services of competent and professional legal, tax, or accounting counsel. The information contained herein has been obtained from sources believed to be reliable but we do not guarantee accuracy or completeness. Publication and distribution of this article is not intended to create, and the information contained herein does not constitute, an attorney-client relationship. No recommendation or advice is being given as to whether any investment or strategy is suitable for a particular investor. It should not be assumed that any investments in securities, companies, sectors or markets identified and described were or will be profitable. All information is current as of the date of herein and is subject to change without notice. Any views or opinions expressed may not reflect those of the firm as a whole.
Returns for each strategy and the corresponding Morningstar Universe reflect the annualized returns for the periods indicated. The Morningstar Universes used for comparative analysis are constructed by Morningstar (median performance) and data is provided to Zacks by Zephyr Style Advisor. The percentile ranking for each Zacks Strategy is based on the gross comparison for Zacks Strategies vs. the indicated universe rounded up to the nearest whole percentile. Other managers included in universe by Morningstar may exhibit style drift when compared to Zacks Investment Management portfolio. Neither Zacks Investment Management nor Zacks Investment Research has any affiliation with Morningstar. Neither Zacks Investment Management nor Zacks Investment Research had any influence of the process Morningstar used to determine this ranking.