Results from Q1 2023 earnings season are arguably carrying extra weight for investors, as many try to gauge how higher interest rates and bank stress may have combined to impact profits in the first three months. As I write, it’s still too early in the reporting season to draw sweeping conclusions. But I do think it’s fair to say that any narratives about an ‘earnings cliff’ can be safely set aside. It’s just not happening.1
As my colleague and the Director of Research at Zacks, Sheraz Mian, put it: “The picture emerging at this early stage is one of resilience and stability, with an above-average proportion of companies beating estimates and providing a good-enough outlook in an uncertain macro environment.”2
Indeed, 77% of the approximately 90 reporting S&P 500 companies have beaten earnings expectations, which marks a higher beat percentage for these specific companies than in each of the previous three quarters. One question that’s emerging about this earnings season is whether analysts were too pessimistic in lowering earnings expectations, or whether corporations are delivering stronger-than-expected results in a better-than-expected macro environment.
I think both are true.
On the analyst side, there hasn’t been adequate appreciation for the idea that the earnings recession likely started about a year ago, which I think implies that we’re nearing the bottom or already past it. Energy sector earnings have distorted the overall picture in the last year, with high commodity prices resulting in a profit surge that skewed results for the broad S&P 500. But when we strip away the energy sector’s contributions, we find that S&P 500 earnings have been contracting on an annual basis since Q2 2022. In short, forward estimates today don’t seem to be considering the possibility of an earnings recovery in the second half of the year.
Banks have also been a key driver in this quarter’s better-than-expected results (to date), but not in the way most investors expected in the wake of regional banking stress. The worst fears of a financial contagion did not come to fruition, and major banks have performed far better than anticipated. As a result, Q1 earnings for Financials are now expected to be up +7.6% from the year-earlier period, a significant improvement from the +0.3% growth expected just one week ago.
The three most prominent players in the space – JPMorgan, Bank of America, and Citigroup –handily beat top- and bottom-line estimates. JPMorgan’s Q1 earnings, for instance, were up an impressive +52.4% from the same period last year on +24.8% higher revenues on record net-interest income. Earnings estimates for the June quarter have been increasing for these major banks as well, which I think investors should read as a significant positive surprise. Remember, just one month ago many were questioning the health and stability of the banking sector.
A final observation I’d make about this earnings season is that operating margins appear to have turned the corner for the positive. The past year has posed many challenges for corporate profits, largely from rising labor costs and some companies’ limited ability to pass on rising input costs to consumers. Those pressures appear to be easing now, and there’s a good argument that margin pressures may have peaked in Q4 2022 (see chart below). This metric is critical, as operating margins are an important gauge of profitability and also a leading indicator for stocks.
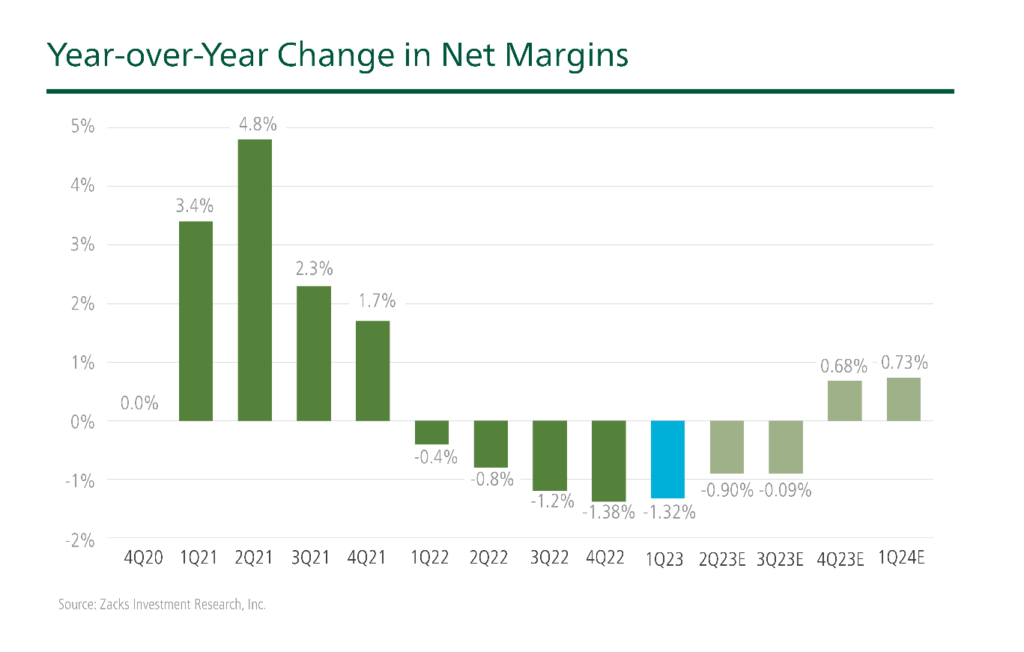
Zacks Investment Research3
Bottom Line for Investors
As I mentioned at the outset of this column, it’s still early in Q1 2023’s earning season, so there will be plenty more insights and takeaways to parse. I’ll likely revisit the earnings story once all the results are in.
But our early read is that earnings overall are shaping up to be far better-than-expected this quarter. In my view, analysts got too cautious in anticipating the fallout from bank stress, which to date has not materialized into much of an economic impact. But there have also been persistent expectations for a recession—which has yet to arrive—baked into estimates. When looking out at estimates for future quarters, the key question becomes: what happens if the U.S. avoids recession altogether?
Disclosure
2 Zacks.com. April 24, 2023. https://www.zacks.com/commentary/2083630/big-tech-earnings-looming-what-to-expect
3 Zacks.com. April 24, 2023. https://www.zacks.com/commentary/2083630/big-tech-earnings-looming-what-to-expect
DISCLOSURE
Past performance is no guarantee of future results. Inherent in any investment is the potential for loss.
Zacks Investment Management, Inc. is a wholly-owned subsidiary of Zacks Investment Research. Zacks Investment Management is an independent Registered Investment Advisory firm and acts as an investment manager for individuals and institutions. Zacks Investment Research is a provider of earnings data and other financial data to institutions and to individuals.
This material is being provided for informational purposes only and nothing herein constitutes investment, legal, accounting or tax advice, or a recommendation to buy, sell or hold a security. Do not act or rely upon the information and advice given in this publication without seeking the services of competent and professional legal, tax, or accounting counsel. Publication and distribution of this article is not intended to create, and the information contained herein does not constitute, an attorney-client relationship. No recommendation or advice is being given as to whether any investment or strategy is suitable for a particular investor. It should not be assumed that any investments in securities, companies, sectors or markets identified and described were or will be profitable. All information is current as of the date of herein and is subject to change without notice. Any views or opinions expressed may not reflect those of the firm as a whole.
Any projections, targets, or estimates in this report are forward looking statements and are based on the firm’s research, analysis, and assumptions. Due to rapidly changing market conditions and the complexity of investment decisions, supplemental information and other sources may be required to make informed investment decisions based on your individual investment objectives and suitability specifications. All expressions of opinions are subject to change without notice. Clients should seek financial advice regarding the appropriateness of investing in any security or investment strategy discussed in this presentation.
Certain economic and market information contained herein has been obtained from published sources prepared by other parties. Zacks Investment Management does not assume any responsibility for the accuracy or completeness of such information. Further, no third party has assumed responsibility for independently verifying the information contained herein and accordingly no such persons make any representations with respect to the accuracy, completeness or reasonableness of the information provided herein. Unless otherwise indicated, market analysis and conclusions are based upon opinions or assumptions that Zacks Investment Management considers to be reasonable. Any investment inherently involves a high degree of risk, beyond any specific risks discussed herein.
The S&P 500 Index is a well-known, unmanaged index of the prices of 500 large-company common stocks, mainly blue-chip stocks, selected by Standard & Poor’s. The S&P 500 Index assumes reinvestment of dividends but does not reflect advisory fees. The volatility of the benchmark may be materially different from the individual performance obtained by a specific investor. An investor cannot invest directly in an index.
The Russell 1000 Growth Index is a well-known, unmanaged index of the prices of 1000 large-company growth common stocks selected by Russell. The Russell 1000 Growth Index assumes reinvestment of dividends but does not reflect advisory fees. An investor cannot invest directly in an index. The volatility of the benchmark may be materially different from the individual performance obtained by a specific investor.
Nasdaq Composite Index is the market capitalization-weighted index of over 3,300 common equities listed on the Nasdaq stock exchange. The types of securities in the index include American depositary receipts, common stocks, real estate investment trusts (REITs) and tracking stocks, as well as limited partnership interests. The index includes all Nasdaq-listed stocks that are not derivatives, preferred shares, funds, exchange-traded funds (ETFs) or debenture securities. An investor cannot invest directly in an index. The volatility of the benchmark may be materially different from the individual performance obtained by a specific investor.
The Dow Jones Industrial Average measures the daily stock market movements of 30 U.S. publicly-traded companies listed on the NASDAQ or the New York Stock Exchange (NYSE). The 30 publicly-owned companies are considered leaders in the United States economy. An investor cannot directly invest in an index. The volatility of the benchmark may be materially different from the individual performance obtained by a specific investor.
The Bloomberg Global Aggregate Index is a flagship measure of global investment grade debt from twenty-four local currency markets. This multi-currency benchmark includes treasury, government-related, corporate and securitized fixed-rate bonds from both developed and emerging markets issuers. An investor cannot invest directly in an index. The volatility of the benchmark may be materially different from the individual performance obtained by a specific investor.
The ICE Exchange-Listed Fixed & Adjustable Rate Preferred Securities Index is a modified market capitalization weighted index composed of preferred stock and securities that are functionally equivalent to preferred stock including, but not limited to, depositary preferred securities, perpetual subordinated debt and certain securities issued by banks and other financial institutions that are eligible for capital treatment with respect to such instruments akin to that received for issuance of straight preferred stock. An investor cannot invest directly in an index. The volatility of the benchmark may be materially different from the individual performance obtained by a specific investor.
The MSCI ACWI ex U.S. Index captures large and mid-cap representation across 22 of 23 Developed Markets (DM) countries (excluding the United States) and 24 Emerging Markets (EM) countries. The index covers approximately 85% of the global equity opportunity set outside the U.S. An investor cannot invest directly in an index. The volatility of the benchmark may be materially different from the individual performance obtained by a specific investor.