At the Federal Reserve’s September 20-21 meeting, officials voted unanimously to raise the benchmark fed funds rate by 75 basis points to a range between 3% and 3.25%. The rate hike was widely expected, but new projections for where rates would finish the year arguably caught the market by surprise.1
On the day following the Fed meeting, it was revealed that nearly every voting Fed member expected rates to finish 2022 at a range between 4% and 4.5%, which almost explicitly implies sizable rate increases at the November and December policy meetings. Any hope that the Fed may slow the size and pace of rate hikes was dashed, and stocks have endured sharp selling pressure ever since.
Many investors and market participants are starting to assume that as long as the Fed is hiking rates and upward pressure is being applied to longer-term interest rates (like the 10-year US Treasury bond yield), then stocks will continue to endure selling pressure. Higher bond yields adversely impact the value of future earnings, and they also give investors an alternative to stocks, the thinking goes. In this environment, investors are increasingly seeing bond yields and stock returns are inversely correlated, which makes the outlook for equities pretty bleak in the next 6-12 months.
But this assumption does not line up with what’s happened historically. Looking at weekly returns over the past 60+ years, the S&P 500 index and 10-year U.S. Treasury bonds have a correlation of approximately 0 – meaning there is no clear relationship between the two. If stocks and bonds always moved in opposite directions, the correlation between the two would be -1.
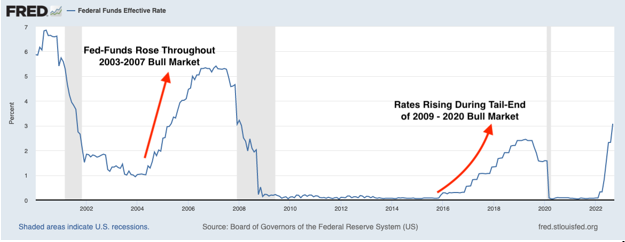
As far as the fed funds rate is concerned, we do not have to go back very far in history to find a time when the Federal Reserve was raising interest rates while stocks were also rising. As seen in the chart below, we had Fed tightening during the 2003-2007 bull market and again during the 2009-2020 bull market.
There is a fundamental flaw in thinking that as interest rates go up stocks will go down, and it’s this: interest rates are not the only thing influencing business activity, consumer spending, corporate profitability, and the direction of the stock market. That’s why throughout history, there are myriad examples of interest rates marching higher while stocks also posted gains – the relationship between the two is not as tight as many are assuming today.
In my view, we will likely see the stock market enter a new bull market while the Federal Reserve is still in tightening mode. To assume that stocks will only start to climb once the Federal Reserve cuts rates or pauses hikes is to assume that stocks move concurrently with economic news and Fed policy, which we know historically has not been the case. Stocks rarely wait for clear signals or good news to rebound.
Bottom Line for Investors
Here’s another reason not to wait for the Federal Reserve to cut or pause rate hikes before liking stocks again: Fed projections are almost always wrong.
Remember, it was just one year ago when the Federal Reserve was talking about ‘transitory inflation’ and signaling to markets that interest rates would remain low for the foreseeable future. Just three months ago, Fed officials were projecting the fed funds rate would finish the year at 3.8%, and today it’s up to 4.5%. These forecasts are simply not reliable enough for investors to hang their hats on. What I can say, however, is that stocks historically have rebounded well before there is clarity on the issues of the day, which in this case are inflation, recession, and the path of fed funds. Investors should not wait for these indicators to get better, knowing that stocks won’t either.
Disclosure
2 Fred Economic Data. 2022. https://fred.stlouisfed.org/series/DFF#
DISCLOSURE
Past performance is no guarantee of future results. Inherent in any investment is the potential for loss.
Zacks Investment Management, Inc. is a wholly-owned subsidiary of Zacks Investment Research. Zacks Investment Management is an independent Registered Investment Advisory firm and acts as an investment manager for individuals and institutions. Zacks Investment Research is a provider of earnings data and other financial data to institutions and to individuals.
This material is being provided for informational purposes only and nothing herein constitutes investment, legal, accounting or tax advice, or a recommendation to buy, sell or hold a security. Do not act or rely upon the information and advice given in this publication without seeking the services of competent and professional legal, tax, or accounting counsel. Publication and distribution of this article is not intended to create, and the information contained herein does not constitute, an attorney-client relationship. No recommendation or advice is being given as to whether any investment or strategy is suitable for a particular investor. It should not be assumed that any investments in securities, companies, sectors or markets identified and described were or will be profitable. All information is current as of the date of herein and is subject to change without notice. Any views or opinions expressed may not reflect those of the firm as a whole.
Any projections, targets, or estimates in this report are forward looking statements and are based on the firm’s research, analysis, and assumptions. Due to rapidly changing market conditions and the complexity of investment decisions, supplemental information and other sources may be required to make informed investment decisions based on your individual investment objectives and suitability specifications. All expressions of opinions are subject to change without notice. Clients should seek financial advice regarding the appropriateness of investing in any security or investment strategy discussed in this presentation.
Certain economic and market information contained herein has been obtained from published sources prepared by other parties. Zacks Investment Management does not assume any responsibility for the accuracy or completeness of such information. Further, no third party has assumed responsibility for independently verifying the information contained herein and accordingly no such persons make any representations with respect to the accuracy, completeness or reasonableness of the information provided herein. Unless otherwise indicated, market analysis and conclusions are based upon opinions or assumptions that Zacks Investment Management considers to be reasonable. Any investment inherently involves a high degree of risk, beyond any specific risks discussed herein.
The S&P 500 Index is a well-known, unmanaged index of the prices of 500 large-company common stocks, mainly blue-chip stocks, selected by Standard & Poor’s. The S&P 500 Index assumes reinvestment of dividends but does not reflect advisory fees. The volatility of the benchmark may be materially different from the individual performance obtained by a specific investor. An investor cannot invest directly in an index.
The Russell 1000 Growth Index is a well-known, unmanaged index of the prices of 1000 large-company growth common stocks selected by Russell. The Russell 1000 Growth Index assumes reinvestment of dividends but does not reflect advisory fees. An investor cannot invest directly in an index. The volatility of the benchmark may be materially different from the individual performance obtained by a specific investor.
Nasdaq Composite Index is the market capitalization-weighted index of over 3,300 common equities listed on the Nasdaq stock exchange. The types of securities in the index include American depositary receipts, common stocks, real estate investment trusts (REITs) and tracking stocks, as well as limited partnership interests. The index includes all Nasdaq-listed stocks that are not derivatives, preferred shares, funds, exchange-traded funds (ETFs) or debenture securities. An investor cannot invest directly in an index. The volatility of the benchmark may be materially different from the individual performance obtained by a specific investor.
The Dow Jones Industrial Average measures the daily stock market movements of 30 U.S. publicly-traded companies listed on the NASDAQ or the New York Stock Exchange (NYSE). The 30 publicly-owned companies are considered leaders in the United States economy. An investor cannot directly invest in an index. The volatility of the benchmark may be materially different from the individual performance obtained by a specific investor.
The Bloomberg Global Aggregate Index is a flagship measure of global investment grade debt from twenty-four local currency markets. This multi-currency benchmark includes treasury, government-related, corporate and securitized fixed-rate bonds from both developed and emerging markets issuers. An investor cannot invest directly in an index. The volatility of the benchmark may be materially different from the individual performance obtained by a specific investor.
The ICE Exchange-Listed Fixed & Adjustable Rate Preferred Securities Index is a modified market capitalization weighted index composed of preferred stock and securities that are functionally equivalent to preferred stock including, but not limited to, depositary preferred securities, perpetual subordinated debt and certain securities issued by banks and other financial institutions that are eligible for capital treatment with respect to such instruments akin to that received for issuance of straight preferred stock. An investor cannot invest directly in an index. The volatility of the benchmark may be materially different from the individual performance obtained by a specific investor.