Expectations for the U.S. economy are seemingly running high. With tax cuts, a rising stock market, historically low unemployment, and solid corporate earnings, it makes sense that investors and consumers alike are optimistic about what lies ahead. At Zacks Investment Management (ZIM), we’re optimistic too, but more so because of what we see when we grind into the economic data.
This week I’ll take a look at a broad cross-section of economic data to paint a picture of how the U.S. economy is doing. The short answer: just fine.
Economic Indicators and Data Worth Eyeing
If an investor were to only look at one economic indicator (though we recommend looking at several), I would suggest checking-in each month on the Conference Board Leading Economic Index, also known as the LEI. The LEI is made up of ten key and influential data points, including, but not limited to Manufacturers’ new orders, nondefense capital goods excluding aircraft orders, building permits, new private housing units, stock prices, consumer expectations for business conditions, and interest rate spreads. In other words, important and forward-looking data.
But there is another, important reason to focus on the LEI: since the LEI came into existence in 1959, no U.S. recession has occurred when the LEI was rising. Indeed, throughout its history, the LEI has been the “canary in the coal mine” when it peaks and then declines for months (sometimes several months). When that trend reversal happens, a recession has followed every time. (According to USA Today)
The chart below should illustrate a couple of things. First is evidence of the LEI peaking and declining prior to U.S. recessions (indicated by gray bars). Second is that currently, the LEI is high and rising. We do not need to see any sign of a peak, nor declines to speak of.

Source: Conference Board
An interest rate spread (10-year U.S. Treasury minus fed funds) is included in the LEI’s data, but another leading indicator we believe is worth eyeing is the yield curve, particularly if it is inverted or close to inverting. On average, the yield curve inverts 16 months prior to an economic recession and 13 months before major stock-market corrections (According to Silverlight Invest). As it stands today, the yield curve has been flattening but is not yet inverted, indicating in our view that the risk of recession is still some time off.
Here is the yield curve at the beginning of 2016 (green, steep) compared with the yield curve at the beginning of 2018 (blue, flatter). It is clear to see the flattening trend, and worth watching closely to see when and if it inverts:
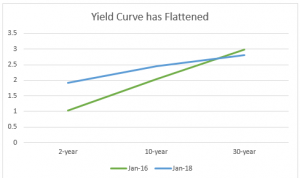
Source: US Department of the Treasury
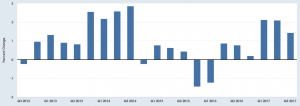
Here are some other key economic data points we believe are also worth watching, in charts:
Personal Consumption Expenditures (Consumer Spending, % change over 5 years)

Source: Federal Reserve Bank of St. Louis
Private Nonresidential Fixed Investment (Business Investment, % change over 5 Years)
Source: Federal Reserve Bank of St. Louis
Manufacturing Sector: Real Output (% change over 5-Years)

Source: Federal Reserve Bank of St. Louis
If we added nonfarm payroll growth (jobs) to this series, it would also show steady growth over the last five years, as would the broader measure of GDP and to a lesser extent, personal disposable income.
Bottom Line for Investors
Economic data has been firm in the U.S., and we expect the growth trend to continue in 2018. We further believe that stock prices should follow.
Disclosure
Past performance is no guarantee of future results. Inherent in any investment is the potential for loss.
Zacks Investment Management, Inc. is a wholly-owned subsidiary of Zacks Investment Research. Zacks Investment Management is an independent Registered Investment Advisory firm and acts as an investment manager for individuals and institutions. Zacks Investment Research is a provider of earnings data and other financial data to institutions and to individuals.
This material is being provided for informational purposes only and nothing herein constitutes investment, legal, accounting or tax advice, or a recommendation to buy, sell or hold a security. Do not act or rely upon the information and advice given in this publication without seeking the services of competent and professional legal, tax, or accounting counsel. The information contained herein has been obtained from sources believed to be reliable but we do not guarantee accuracy or completeness. Publication and distribution of this article is not intended to create, and the information contained herein does not constitute, an attorney-client relationship. No recommendation or advice is being given as to whether any investment or strategy is suitable for a particular investor. It should not be assumed that any investments in securities, companies, sectors or markets identified and described were or will be profitable. All information is current as of the date of herein and is subject to change without notice. Any views or opinions expressed may not reflect those of the firm as a whole.
Any projections, targets, or estimates in this report are forward looking statements and are based on the firm’s research, analysis, and assumptions. Due to rapidly changing market conditions and the complexity of investment decisions, supplemental information and other sources may be required to make informed investment decisions based on your individual investment objectives and suitability specifications. All expressions of opinions are subject to change without notice. Clients should seek financial advice regarding the appropriateness of investing in any security or investment strategy discussed in this presentation.
Certain economic and market information contained herein has been obtained from published sources prepared by other parties. Zacks Investment Management does not assume any responsibility for the accuracy or completeness of such information. Further, no third party has assumed responsibility for independently verifying the information contained herein and accordingly no such persons make any representations with respect to the accuracy, completeness or reasonableness of the information provided herein. Unless otherwise indicated, market analysis and conclusions are based upon opinions or assumptions that Zacks Investment Management considers to be reasonable.
Zacks Investment Management reserves the right to amend the terms or rescind the free stress test offer at any time and for any reason at its discretion.
2 Zacks Investment Management reserves the right to amend the terms or rescind the free stress test offer at any time and for any reason at its discretion.