A little over a month ago, the Federal Reserve announced plans to gradually unwind (“taper”) their quantitative easing programs. The plans put forward were to trim the monthly bond and mortgage security purchases by $15 billion per month, effectively ending the QE program by June 2022.
By the end of November, however, those plans had changed.
In a testimony to the Senate Banking Committee on November 30th, Federal Reserve Chairman Jerome Powell admitted that “pricing increases have spread much more broadly” than anticipated in the economy, and that the Fed “didn’t predict supply-side problems.” In other words, inflation is running hotter-than-expected for longer-than-expected, and the Fed is responding by accelerating the taper and potentially setting the stage to raise interest rates on a faster timeline next year.1
From an investment standpoint, a more hawkish Federal Reserve is often believed to be problematic. A reduction in monetary stimulus, coupled with rising interest rates, surely cannot be good for stocks, right?
A quick review of recent history can help us address this question. There is only one previous instance of Fed tapering, in 2013, and the stock market endured some short-term selling pressure in the midst of the QE’s unwinding. But the selling pressure did not last very long. From the time Ben Bernanke announced QE would be reduced (summer 2013) to the actual end of QE (fall 2014), the S&P 500 went up over +20%.2
The Fed then started raising interest rates in December 2015, pushing the fed funds rate from 0.5% in December 2015 all the way up to 2.5% by December 2018. As readers can see from the chart below, Fed tightening during the last bull market caused a few blips and pullbacks, but QE tapers and rate hikes were not powerful enough to prevent the stock market from pushing higher.
The S&P 500 Over the Last Decade
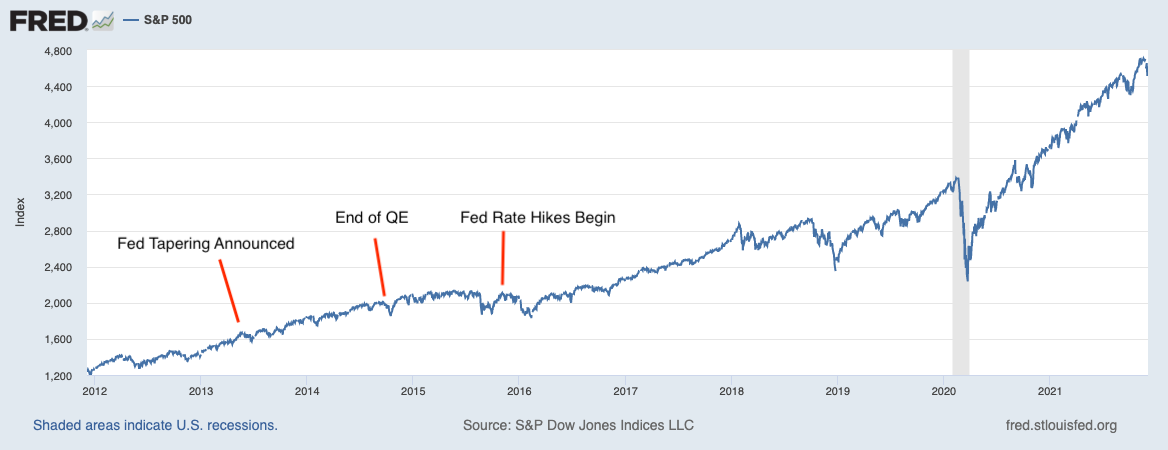
Source: Federal Reserve Bank of St. Louis3
I similarly do not expect a shift in the Federal Reserve’s current messaging and policy to have a meaningful effect on stocks. The stock market has long known about the Fed’s plans to gradually remove monetary policy stimulus, and a slightly accelerated, well-telegraphed timeline for policy changes should not serve as a negative surprise.
In fact, markets may even welcome an accelerated taper – since QE purchases put downward pressure on long-dated U.S. Treasury bond yields, QE is effectively flattening the yield curve and squeezing bank profits in the process. If an accelerated taper allows longer duration bond yields to move higher while short-term interest rates remain close to zero, it could spur more bank lending – a good outcome for the economy.
As for the Fed moving up their timeline for interest rate increases, I think it is important for investors to remember that bull markets tend to end after the Fed’s last rate hike – not their first one. As readers can see in the S&P 500 chart above, the U.S. stock market can continue to do well even as the Federal Reserve engages in fed funds rate increases. That process may begin in 2022, but it does not mean the bull market has to end as a result.
Bottom Line for Investors
In my view, the Federal Reserve’s shifting message and policy is in response to a good problem. In the words of New York Fed President John Williams, the U.S. economy is “roaring back,” and supply/demand imbalances are putting pressure on prices. Demand is above pre-pandemic levels, and supply can’t keep up. I don’t see this as a permanent problem.
Even still, the Fed is probably right to take some action, even if only for optics. A slightly accelerated taper timeline and the possibility of rising rates next year are not likely to move the needle on inflation at all, in my view, and I concurrently don’t see much effect of this tightening on the economy or stocks. I’ve written before that corporate earnings and economic growth matter more than the Fed, and I do not think a slight shift in the Fed’s messaging and policy will affect either in the coming year.
Disclosure
2 The Balance. November 9, 2021. https://www.thebalance.com/fed-funds-rate-history-highs-lows-3306135
3 Fred Economic Data. December 6, 2021. https://fred.stlouisfed.org/series/SP500
DISCLOSURE
Past performance is no guarantee of future results. Inherent in any investment is the potential for loss.
Zacks Investment Management, Inc. is a wholly-owned subsidiary of Zacks Investment Research. Zacks Investment Management is an independent Registered Investment Advisory firm and acts as an investment manager for individuals and institutions. Zacks Investment Research is a provider of earnings data and other financial data to institutions and to individuals.
This material is being provided for informational purposes only and nothing herein constitutes investment, legal, accounting or tax advice, or a recommendation to buy, sell or hold a security. Do not act or rely upon the information and advice given in this publication without seeking the services of competent and professional legal, tax, or accounting counsel. Publication and distribution of this article is not intended to create, and the information contained herein does not constitute, an attorney-client relationship. No recommendation or advice is being given as to whether any investment or strategy is suitable for a particular investor. It should not be assumed that any investments in securities, companies, sectors or markets identified and described were or will be profitable. All information is current as of the date of herein and is subject to change without notice. Any views or opinions expressed may not reflect those of the firm as a whole.
Any projections, targets, or estimates in this report are forward looking statements and are based on the firm’s research, analysis, and assumptions. Due to rapidly changing market conditions and the complexity of investment decisions, supplemental information and other sources may be required to make informed investment decisions based on your individual investment objectives and suitability specifications. All expressions of opinions are subject to change without notice. Clients should seek financial advice regarding the appropriateness of investing in any security or investment strategy discussed in this presentation.
Certain economic and market information contained herein has been obtained from published sources prepared by other parties. Zacks Investment Management does not assume any responsibility for the accuracy or completeness of such information. Further, no third party has assumed responsibility for independently verifying the information contained herein and accordingly no such persons make any representations with respect to the accuracy, completeness or reasonableness of the information provided herein. Unless otherwise indicated, market analysis and conclusions are based upon opinions or assumptions that Zacks Investment Management considers to be reasonable. Any investment inherently involves a high degree of risk, beyond any specific risks discussed herein.
The S&P 500 Index is a well-known, unmanaged index of the prices of 500 large-company common stocks, mainly blue-chip stocks, selected by Standard & Poor’s. The S&P 500 Index assumes reinvestment of dividends but does not reflect advisory fees. The volatility of the benchmark may be materially different from the individual performance obtained by a specific investor. An investor cannot invest directly in an index.
The Russell 1000 Growth Index is a well-known, unmanaged index of the prices of 1000 large-company growth common stocks selected by Russell. The Russell 1000 Growth Index assumes reinvestment of dividends but does not reflect advisory fees. An investor cannot invest directly in an index. The volatility of the benchmark may be materially different from the individual performance obtained by a specific investor.
Nasdaq Composite Index is the market capitalization-weighted index of over 3,300 common equities listed on the Nasdaq stock exchange. The types of securities in the index include American depositary receipts, common stocks, real estate investment trusts (REITs) and tracking stocks, as well as limited partnership interests. The index includes all Nasdaq-listed stocks that are not derivatives, preferred shares, funds, exchange-traded funds (ETFs) or debenture securities. An investor cannot invest directly in an index. The volatility of the benchmark may be materially different from the individual performance obtained by a specific investor.
The Dow Jones Industrial Average measures the daily stock market movements of 30 U.S. publicly-traded companies listed on the NASDAQ or the New York Stock Exchange (NYSE). The 30 publicly-owned companies are considered leaders in the United States economy. An investor cannot directly invest in an index. The volatility of the benchmark may be materially different from the individual performance obtained by a specific investor.