Is Rising Inflation Diminishing Hope for Another Rate Cut?
At the start of the year, developed-market central banks like the Fed, the European Central Bank, and the Bank of England were almost uniformly poised to gradually ease rates.
A lot can change in a quarter.
As seen in the chart below, markets have rapidly repriced the monetary policy outlook in response to the conflict in Iran. What started as an expectation for steady rate cuts in 2026 has shifted the expectation for rate hikes.1
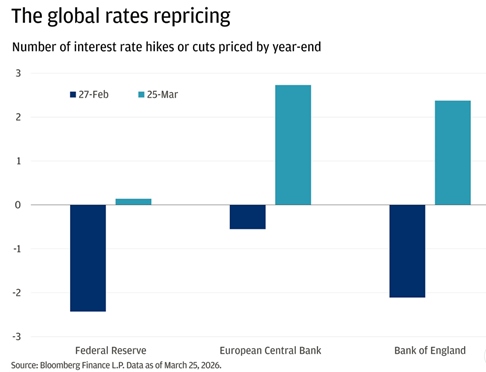
The catalyst behind this repricing is clear. The closure of the Strait of Hormuz has pushed oil and natural gas prices higher, feeding directly into global inflation data. Here in the U.S., March’s Consumer Price Index (CPI) report showed headline inflation rising 3.3% year-over-year, a sharp increase from February’s 2.4% pace, with energy prices up 12.5% and gasoline alone jumping nearly 19%. As seen on the chart below, there’s a sharp divergence in inflation data when it includes energy prices (headline), versus when it’s stripped out (core).
Consumer Price Index, January 2024 – March 2026 (blue line is headline, green line is core)
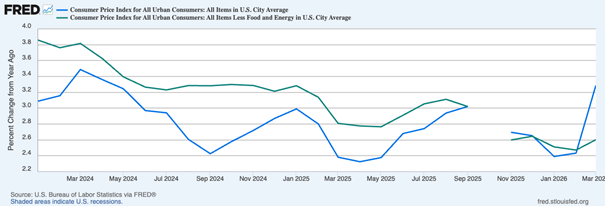
The gap in the chart seen above is important. While headline inflation jumped, core CPI rose a lesser 2.6% year-over-year, which was slightly below expectations. Food prices were largely flat, and many goods categories showed limited pass-through from higher energy costs. In other words, it’s clear that inflation pressure is not broad-based at this stage.
This is an important distinction when considering monetary policy in the U.S. versus abroad. In Europe and the U.K., central banks operate under more explicitly inflation-focused mandates and economies are more exposed to energy costs. The U.S. jobs market is equally important to the Fed, and our economy is far less exposed, given we’re a net exporter of oil and gas. That’s why I think the market pricing-in Fed hikes in 2026 is premature and likely off-base.
To be sure, a prolonged period of elevated energy prices could justify keeping rates higher for longer, delaying the timing of rate cuts. But despite a meaningful shift in underlying inflation dynamics or expectations, the bar for renewed rate hikes remains high, in my view. In that sense, markets may be interpreting a change in timing as a change in direction. That would make a potential rate cut in 2026 a positive surprise, which I see as a net positive for stocks.
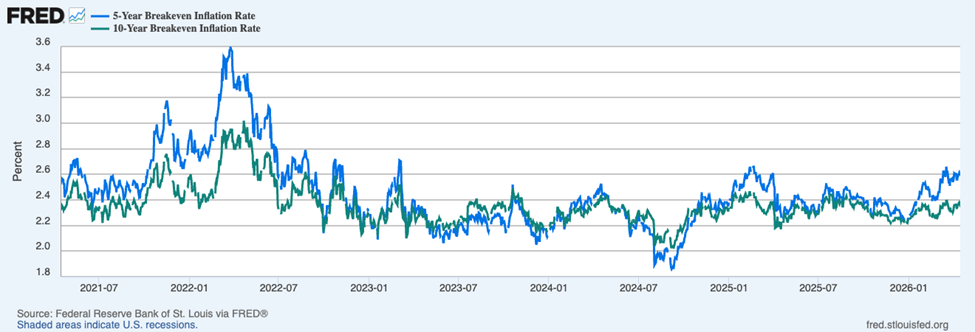
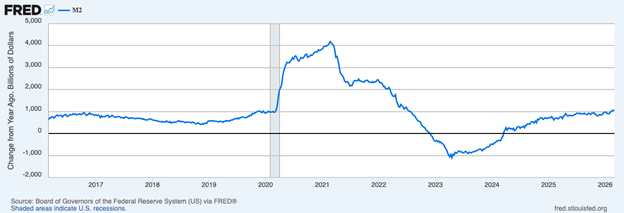
My conviction on this point comes from looking at market-based measures such as 5- and 10-year breakeven rates, which continue to hover in the low-to-mid 2% range. And I’d also cite money supply growth, which has returned to a much more modest pace and is broadly in line with pre-pandemic trends.
5-Year Breakeven Inflation Rate (blue) and 10-Year Breakeven Inflation Rate (green)
M2 Money Supply (Year-Over-Year Change in $ Billions, 2016 – 2026)
Investors should keep in mind that not every inflation spike carries the same policy implications. A rise in headline CPI driven by energy is very different from a broad, demand-led acceleration in prices, and central banks, and especially the Federal Reserve, know that. That is why I think the Fed is more likely to treat the latest inflation data as a reason for caution, not a reason to reverse course. Other developed-market central banks may have less room to look through the shock, but in the U.S., the more likely policy shift is a delay to easing, not the start of a new hiking cycle.
Bottom Line for Investors
Even if markets continue to debate the path of monetary policy, the bigger story for investors may be that the economy appears less dependent on near-term Fed decisions than many assume. S&P 500 earnings are expected to grow to +13.1% in Q1 on +9% higher revenues, with early reports showing +76.6% earnings growth and strong beat rates. Remember that this strength has emerged even as the Fed has taken a relatively limited role in actively supporting growth.
Looking ahead, policy expectations may continue to shift, but underlying drivers of markets like earnings, demand, and corporate fundamentals continue to look strong, regardless of what action central banks take in the near term.
In environments like this, staying aligned with a long-term plan matters more than reacting to short-term changes.
Our free guide, The Power of Financial Planning with Zacks Investment Management6, outlines how to navigate shifting rate and inflation expectations—and what to consider as you build a more complete financial plan, including:
- Investment Planning
- Retirement Income Planning
- Cash Flow and Budgeting
- Tax and Insurance Planning
- Insurance Planning
- Estate Planning
- …and other topics
If you have $500,000 or more to invest, download our guide, The Power of Financial Planning with Zacks Investment Management6 for a closer look at how a thoughtful plan can help you stay focused and aligned with your long-term goals.
Disclosure
2 ZIM may amend or rescind the free guide “The Power of Financial Planning with Zacks Investment Management” for any reason and at ZIM’s discretion.
3 Fred Economic Data. April 10, 2026. https://fred.stlouisfed.org/series/CPIAUCSL
4 Fred Economic Data. April 10, 2026. https://fred.stlouisfed.org/series/EXPINF5YR
5 Fred Economic Data. March 24, 2026. https://fred.stlouisfed.org/series/WM2NS
6 ZIM may amend or rescind the free guide “The Power of Financial Planning with Zacks Investment Management” for any reason and at ZIM’s discretion.
DISCLOSURE
Past performance is no guarantee of future results. Inherent in any investment is the potential for loss.
Zacks Investment Management, Inc. is a wholly-owned subsidiary of Zacks Investment Research. Zacks Investment Management is an independent Registered Investment Advisory firm and acts as an investment manager for individuals and institutions. Zacks Investment Research is a provider of earnings data and other financial data to institutions and to individuals.
This material is being provided for informational purposes only and nothing herein constitutes investment, legal, accounting or tax advice, or a recommendation to buy, sell or hold a security. Do not act or rely upon the information and advice given in this publication without seeking the services of competent and professional legal, tax, or accounting counsel. Publication and distribution of this article is not intended to create, and the information contained herein does not constitute, an attorney-client relationship. No recommendation or advice is being given as to whether any investment or strategy is suitable for a particular investor. It should not be assumed that any investments in securities, companies, sectors or markets identified and described were or will be profitable. All information is current as of the date of herein and is subject to change without notice. Any views or opinions expressed may not reflect those of the firm as a whole.
Any projections, targets, or estimates in this report are forward looking statements and are based on the firm’s research, analysis, and assumptions. Due to rapidly changing market conditions and the complexity of investment decisions, supplemental information and other sources may be required to make informed investment decisions based on your individual investment objectives and suitability specifications. All expressions of opinions are subject to change without notice. Clients should seek financial advice regarding the appropriateness of investing in any security or investment strategy discussed in this presentation.
Certain economic and market information contained herein has been obtained from published sources prepared by other parties. Zacks Investment Management does not assume any responsibility for the accuracy or completeness of such information. Further, no third party has assumed responsibility for independently verifying the information contained herein and accordingly no such persons make any representations with respect to the accuracy, completeness or reasonableness of the information provided herein. Unless otherwise indicated, market analysis and conclusions are based upon opinions or assumptions that Zacks Investment Management considers to be reasonable. Any investment inherently involves a high degree of risk, beyond any specific risks discussed herein.
The S&P 500 Index is a well-known, unmanaged index of the prices of 500 large-company common stocks, mainly blue-chip stocks, selected by Standard & Poor’s. The S&P 500 Index assumes reinvestment of dividends but does not reflect advisory fees. The volatility of the benchmark may be materially different from the individual performance obtained by a specific investor. An investor cannot invest directly in an index.
The S&P 500 High Dividend Index serves as a benchmark for income seeking equity investors. The index is designed to measure the performance of 80 high yield companies within the S&P 500 and is equally weighted to best represent the performance of this group, regardless of constituent size. An investor cannot invest directly in this Index. The volatility of the benchmark may be materially different from the individual performance obtained by a specific investor.
The S&P 500 Buyback Index is designed to measure the performance of the top 100 stocks with the highest buyback ratios in the S&P 500. An investor cannot invest directly in this Index. The volatility of the benchmark may be materially different from the individual performance obtained by a specific investor.