The Bond Market Is Sending a Message
Bond yields have moved higher in recent weeks, which has prompted a debate among market participants as to the potential cause: rising inflation expectations, market consternation at rising deficits in the U.S. and abroad, sinking global demand for Treasurys, or some combination of forces.1
10- and 30-Year U.S. Treasury Bond Yields, Year-to-Date
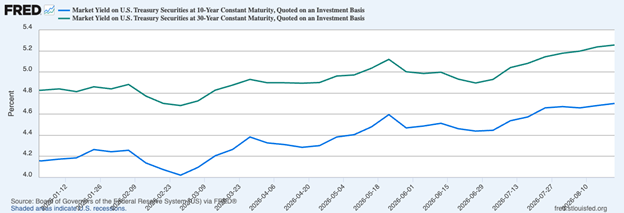
Then, a surprise announcement last week by Treasury Secretary Scott Bessent sent the debate into overdrive.
Secretary Bessent announced plans to expand long-dated U.S. Treasury bond buybacks, with the U.S. Department of the Treasury at least doubling the size of certain buyback operations from $2 billion to $4 billion. The buybacks would focus on the long end of the curve—meaning 10- and 30-year U.S. Treasurys—with the move framed as an effort to support market functioning and liquidity.
What Today’s Market Signals Could Mean for Your Portfolio
The bond market can offer valuable clues about what may lie ahead for investors. Today, shifting yields and changing expectations are sending signals worth watching closely.
Our latest August Stock Market Outlook Report2 takes a closer look at what the bond market may be telling investors and what it could mean for your portfolio.
Inside, you’ll learn:
- Asset allocation guidelines for today’s market environment
- Expert forecasts for inflation, rates, and economic trends
- Industry tables and rankings to help you spot opportunities
- Buy-side and sell-side consensus insights at a glance
- And much more!
If you have $500,000 or more to invest, claim your complimentary copy of the report and see how shifting market trends could influence opportunities in the months ahead.
IT’S FREE. Download our August Stock Market Outlook Report2
But there seemed to be one glaring problem—there was no noticeable issue with liquidity or the ‘plumbing’ of Treasury markets. Treasury auctions were still clearing, dealers were not visibly pulling back, and the market was not facing the kind of forced selling we saw in March 2020. Markets took the news skeptically, and yields ultimately ticked higher—not lower.
I won’t go too deep into the weeds here, but the signal taken from markets was that the Department of the Treasury was intervening in bond markets not because of liquidity issues, but because of pricing issues. In other words, the actual goal was to put a support under bond prices, which equates to an effort to push yields lower, arguably in support of keeping borrowing rates low and financial conditions accommodative.
This was the story that was playing out in headlines last week, but I think it all lacked important context. A $4 billion buyback operation sounds large in isolation, especially after headlines emphasized that Treasury was “doubling” the size of certain operations. But scale is important here, as Treasury cash securities trade around $1 trillion per day in a roughly $32.2 trillion Treasury market. In that context, a $2 billion buyback increase is unlikely to materially change the market’s supply-demand balance on its own.
Rising long-term rates are usually framed as a negative, because they can raise borrowing costs, push mortgage rates higher, and weigh on stock valuations. All these outcomes are real and possible, but rising yields can also serve as an important market signal. When investors demand more compensation to lend for 10, 20, or 30 years, they may be sending a message about inflation, Treasury supply, fiscal policy, or uncertainty. In this sense, markets can ‘demand’ a certain discipline to push policymakers into difficult choices.
There is also a constructive side of the yield story that often gets overlooked.
First, higher yields mean investors are being paid more to own bonds over time. This yield compensation can come with price volatility, but it does improve the overall income profile of high-quality fixed income for long-term investors.
Second, a steeper yield, where long duration bonds see more upward pressure than the short end of the curve, can improve the economics of bank lending. Banks generally fund themselves at shorter-term rates and lend at longer-term rates. When long-term rates rise relative to short-term rates, lending can become more profitable. In the current context, loans and leases in bank credit for all commercial banks were up 7.3% year-over-year as of mid-August, arguably aided in part by rising long duration yields.
Ultimately, higher yields are not automatically positive or negative, but they do carry important information. If yields are rising because growth remains resilient, the economy and corporate earnings may be able to absorb some of the pressure. If yields are rising because inflation expectations or fiscal concerns are worsening, investors should take that signal seriously. For now, I don’t think the recent moves have been sharp enough to suggest a bond market in crisis. But they have been meaningful enough to remind investors that long-term rates, federal borrowing needs, and inflation expectations all deserve close attention.
Bottom Line for Investors
Rising long-term yields deserve attention, but they do not automatically point to a bond market crisis. They are a signal—about inflation, growth, Treasury supply, deficits, and the return investors require to lend money for longer periods.
The right response is not to react emotionally to every move in rates. It is to listen to what the bond market is saying, while keeping the message in perspective.
Of course, the bond market is only one of many forces shaping the investment landscape today.
For a broader look at what investors should be watching, download our latest August Stock Market Outlook Report3. We break down key market and economic trends, and what they could mean for your portfolio in the months ahead.
Inside, you’ll learn:
- Asset allocation guidelines for today’s market environment
- Expert forecasts for inflation, rates, and economic trends
- Industry tables and rankings to help you spot opportunities
- Buy-side and sell-side consensus insights at a glance
- And much more!
If you have $500,000 or more to invest, claim your complimentary copy of the report and see how shifting market trends could influence opportunities in the months ahead.
IT’S FREE. Download our August Stock Market Outlook Report3
Disclosure
2 Fred Economic Data. August 26, 2026. https://fred.stlouisfed.org/series/DGS10
3 Zacks Investment Management reserves the right to amend the terms or rescind the free Stock Market Outlook Report offer at any time and for any reason at its discretion.
4 Zacks Investment Management reserves the right to amend the terms or rescind the free Stock Market Outlook Report offer at any time and for any reason at its discretion.
DISCLOSURE
Past performance is no guarantee of future results. Inherent in any investment is the potential for loss.
Zacks Investment Management, Inc. is a wholly-owned subsidiary of Zacks Investment Research. Zacks Investment Management is an independent Registered Investment Advisory firm and acts as an investment manager for individuals and institutions. Zacks Investment Research is a provider of earnings data and other financial data to institutions and to individuals.
This material is being provided for informational purposes only and nothing herein constitutes investment, legal, accounting or tax advice, or a recommendation to buy, sell or hold a security. Do not act or rely upon the information and advice given in this publication without seeking the services of competent and professional legal, tax, or accounting counsel. Publication and distribution of this article is not intended to create, and the information contained herein does not constitute, an attorney-client relationship. No recommendation or advice is being given as to whether any investment or strategy is suitable for a particular investor. It should not be assumed that any investments in securities, companies, sectors or markets identified and described were or will be profitable. All information is current as of the date of herein and is subject to change without notice. Any views or opinions expressed may not reflect those of the firm as a whole.
Any projections, targets, or estimates in this report are forward looking statements and are based on the firm’s research, analysis, and assumptions. Due to rapidly changing market conditions and the complexity of investment decisions, supplemental information and other sources may be required to make informed investment decisions based on your individual investment objectives and suitability specifications. All expressions of opinions are subject to change without notice. Clients should seek financial advice regarding the appropriateness of investing in any security or investment strategy discussed in this presentation.
Certain economic and market information contained herein has been obtained from published sources prepared by other parties. Zacks Investment Management does not assume any responsibility for the accuracy or completeness of such information. Further, no third party has assumed responsibility for independently verifying the information contained herein and accordingly no such persons make any representations with respect to the accuracy, completeness or reasonableness of the information provided herein. Unless otherwise indicated, market analysis and conclusions are based upon opinions or assumptions that Zacks Investment Management considers to be reasonable. Any investment inherently involves a high degree of risk, beyond any specific risks discussed herein.
The S&P 500 Index is a well-known, unmanaged index of the prices of 500 large-company common stocks, mainly blue-chip stocks, selected by Standard & Poor’s. The S&P 500 Index assumes reinvestment of dividends but does not reflect advisory fees. The volatility of the benchmark may be materially different from the individual performance obtained by a specific investor. An investor cannot invest directly in an index.
The Russell 2000 Index is a well-known, unmanaged index of the prices of 2000 small-cap company common stocks, selected by Russell. The Russell 2000 Index assumes reinvestment of dividends but does not reflect advisory fees. An investor cannot invest directly in an index. The volatility of the benchmark may be materially different from the individual performance obtained by a specific investor.
The Nasdaq Composite Index measures all Nasdaq domestic and international based common type stocks listed on The Nasdaq Stock Market. To be eligible for inclusion in the Index, the security's U.S. listing must be exclusively on The Nasdaq Stock Market (unless the security was dually listed on another U.S. market prior to January 1, 2004 and has continuously maintained such listing). The security types eligible for the Index include common stocks, ordinary shares, ADRs, shares of beneficial interest or limited partnership interests and tracking stocks. Security types not included in the Index are closed-end funds, convertible debentures, exchange traded funds, preferred stocks, rights, warrants, units and other derivative securities. An investor cannot invest directly in an index.