Can Stocks Handle 5% Long-Term Yields?
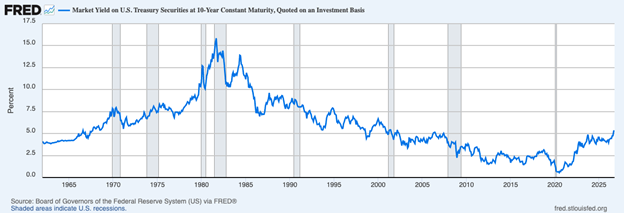
As I write, the 10-year U.S. Treasury bond yield is hovering around 5.25%, which marks quite a move from the roughly 4.20% level where it started 2026. Some prognosticators warned that if the 10-year moved above the 4.5% or 5% threshold, it would surely cause some consternation in equity markets. And yet here we are, with major U.S. stock indices reaching all-time highs.1
So how is it that bond yields could make such a big move while the equity market remains largely unfazed?
In my view, a large part of the answer is that the economy is growing at a faster rate than many appreciate, and also that companies’ earning power has been rising alongside their borrowing costs. The Bureau of Economic Analysis reported that real GDP grew at a 2.2% annualized pace in the second quarter. In nominal terms, before adjusting for inflation, the economy grew at an 8.5% annualized rate. That’s big growth in dollar terms.
What Do Rising Bond Yields Mean for Your Portfolio?
Higher bond yields have raised concerns about borrowing costs and stock prices. Yet major U.S. stock indices remain near all-time highs. What could explain this, and what should investors watch next?
Our latest October Stock Market Outlook Report2 examines the economic trends and market conditions shaping the investment landscape to help you put today’s headlines into perspective.
Inside, you’ll learn:
- Asset allocation guidelines for today’s market environment
- Expert forecasts for inflation, rates, and economic trends
- Industry tables and rankings to help you spot opportunities
- Buy-side and sell-side consensus insights at a glance
- And much more!
Claim your complimentary copy of the report to learn how higher interest rates and changing economic conditions could affect your portfolio in the months ahead.
Download our October Stock Market Outlook Report2
Most GDP headlines focus on the real, inflation-adjusted growth figure. But businesses collect revenues and pay interest in nominal dollars. When sales grow through a combination of higher volumes and prices, companies have an opportunity to increase the cash flows available to cover financing costs and reward shareholders. BEA reported a $384 billion increase in the annualized level of corporate profits from current production, which the market takes as a sign of very solid activity.
Inflation complicates that picture, of course, because higher prices also raise operating costs and stretch household budgets. For equity investors, the key is how much of that additional revenue ultimately translates into profit.
There is also a timing issue. While Treasury yields can change daily, the interest expense on existing fixed-rate debt changes as that debt is refinanced. Businesses that previously secured longer-term financing have more time to adjust than borrowers facing an immediate rate reset.
Households and smaller businesses can feel the impact much faster. The average 30-year mortgage rate recently reached 7.28%, up from 6.34% a year earlier. On a $400,000 mortgage, that difference adds roughly $250 to the monthly principal-and-interest payment. For a small business, one additional percentage point of interest on a $1 million loan adds $10,000 in annual expense. Those higher costs can influence decisions about buying a home, purchasing equipment, or expanding a business.
For equity investors, the forward-looking question is what happens as more of the economy gradually refinances at today’s higher rates. For businesses, higher borrowing costs raise the return companies need to generate for new investments to make sense. What’s more, Treasurys yielding more than 5% give investors a more attractive low-risk alternative, which means stocks have to offer enough earnings growth and return potential to justify taking on more risk. Yields of 5% may not be a death knell for stocks, but they do raise the hurdle companies need to clear to keep attracting capital.
This all said, stocks have been here before and have done just fine.
From 1967 through 2001, the 10-year Treasury yield averaged at least 5% every single year. Over that same 35-year stretch, the S&P 500, including dividends, delivered an annualized return of over 11%, even with several bear markets and recessions along the way. So while today’s yields may feel high relative to the post-2008 era, history shows that equities can still generate strong long-term returns in a much higher-rate environment.
10-year U.S. Treasury Bond Yield (1962 – present)
Bottom Line for Investors
In my view, the real test will come if elevated rates persist long enough to coincide with slower sales and weaker earnings growth. That combination would make today’s valuations more difficult to justify.
For now, the earnings backdrop gives me reason to remain constructive on equities. Higher yields raise the bar, but strong profit growth can still clear it. In my view, the bigger risk would be a combination of persistently high rates and weakening earnings—not the 5% yield threshold by itself.
What should investors watch as higher borrowing costs work their way through the economy? Our latest October Stock Market Outlook Report2 takes a closer look at the trends shaping markets to help you make informed decisions for your portfolio.
Inside, you’ll learn:
- Asset allocation guidelines for today’s market environment
- Expert forecasts for inflation, rates, and economic trends
- Industry tables and rankings to help you spot opportunities
- Buy-side and sell-side consensus insights at a glance
- And much more!
Claim your complimentary copy of the report to learn how higher interest rates and changing economic conditions could affect your portfolio in the months ahead.
Download our October Stock Market Outlook Report2
Disclosure
2 Zacks Investment Management reserves the right to amend the terms or rescind the free October Stock Market Outlook Report offer at any time and for any reason at its discretion.
3 FRED, Fred Economic Data. October 6, 2026. “Market Yield on U.S. Treasury Securities at 10-Year Constant Maturity, Quoted on an Investment Basis (DGS10).”
DISCLOSURE
Past performance is no guarantee of future results. Inherent in any investment is the potential for loss.
Zacks Investment Management, Inc. is a wholly-owned subsidiary of Zacks Investment Research. Zacks Investment Management is an independent Registered Investment Advisory firm and acts as an investment manager for individuals and institutions. Zacks Investment Research is a provider of earnings data and other financial data to institutions and to individuals.
This material is being provided for informational purposes only and nothing herein constitutes investment, legal, accounting or tax advice, or a recommendation to buy, sell or hold a security. Do not act or rely upon the information and advice given in this publication without seeking the services of competent and professional legal, tax, or accounting counsel. Publication and distribution of this article is not intended to create, and the information contained herein does not constitute, an attorney-client relationship. No recommendation or advice is being given as to whether any investment or strategy is suitable for a particular investor. It should not be assumed that any investments in securities, companies, sectors or markets identified and described were or will be profitable. All information is current as of the date of herein and is subject to change without notice. Any views or opinions expressed may not reflect those of the firm as a whole.
Any projections, targets, or estimates in this report are forward looking statements and are based on the firm’s research, analysis, and assumptions. Due to rapidly changing market conditions and the complexity of investment decisions, supplemental information and other sources may be required to make informed investment decisions based on your individual investment objectives and suitability specifications. All expressions of opinions are subject to change without notice. Clients should seek financial advice regarding the appropriateness of investing in any security or investment strategy discussed in this presentation.
Certain economic and market information contained herein has been obtained from published sources prepared by other parties. Zacks Investment Management does not assume any responsibility for the accuracy or completeness of such information. Further, no third party has assumed responsibility for independently verifying the information contained herein and accordingly no such persons make any representations with respect to the accuracy, completeness or reasonableness of the information provided herein. Unless otherwise indicated, market analysis and conclusions are based upon opinions or assumptions that Zacks Investment Management considers to be reasonable. Any investment inherently involves a high degree of risk, beyond any specific risks discussed herein.
The S&P 500 Index is a well-known, unmanaged index of the prices of 500 large-company common stocks, mainly blue-chip stocks, selected by Standard & Poor’s. The S&P 500 Index assumes reinvestment of dividends but does not reflect advisory fees. The volatility of the benchmark may be materially different from the individual performance obtained by a specific investor. An investor cannot invest directly in an index.
The Nasdaq Composite Index measures all Nasdaq domestic and international based common type stocks listed on The Nasdaq Stock Market. To be eligible for inclusion in the Index, the security's U.S. listing must be exclusively on The Nasdaq Stock Market (unless the security was dually listed on another U.S. market prior to January 1, 2004 and has continuously maintained such listing). The security types eligible for the Index include common stocks, ordinary shares, ADRs, shares of beneficial interest or limited partnership interests and tracking stocks. Security types not included in the Index are closed-end funds, convertible debentures, exchange traded funds, preferred stocks, rights, warrants, units and other derivative securities. An investor cannot invest directly in an index.