U.S. stocks have been trending solidly higher for over a year, with very few episodes of sustained downside volatility. From the bottom of the March 2020 Covid-19 bear market to the end of 2020, the S&P 500 charged +68% higher. In Q1 2021, the index rose another +6.2%, again with no material pullbacks. I don’t want to spoil the fun, but these types of extended winning streaks aren’t that normal.1
Since 1980, the S&P 500 has experienced an average intra-year drop of -14.3%. As you can see from a chart below of the S&P 500 over the last year (from May 1, 2020 to May 1, 2021), however, the equity market has not even come close to that kind of pullback. There was a patch of downside volatility during the late fall in 2020, but it did not produce a pullback of more than -10%. In fact, there has not been a double-digit pullback yet in this new bull market.2
__________________________________________________________________________
How Should Investors Prepare for a Double-Digit Correction?
The best way to prepare for the possibility of a stock market correction is to prepare mentally, maintain a well-diversified portfolio, and stay focused on the hard data, so you do not make emotional decisions when the market experiences a sharp and sudden pullback.
To help you stay focused on key data points and fundamentals that could impact your investments in the long term and help you prepare for a correction, I am offering all readers an exclusive look at our May Stock Market Outlook Report. This report contains some of our key forecasts to consider such as:
- Zacks Rank S&P 500 Sector Picks
- Economic expectations for the rest of the year
- Zacks May view on equity markets
- The Impact of Covid-19 vaccine
- U.S. returns expectations for 2021
- What produces 2021 optimism?
- Sell-side and buy-side consensus
- And much more
If you have $500,000 or more to invest and want to learn more about these forecasts, click on the link below to get your free report today!
IT’S FREE. Download the Just-Released May 2021 Stock Market Outlook3
__________________________________________________________________________
S&P 500 from May 1, 2020 to May 1, 2021
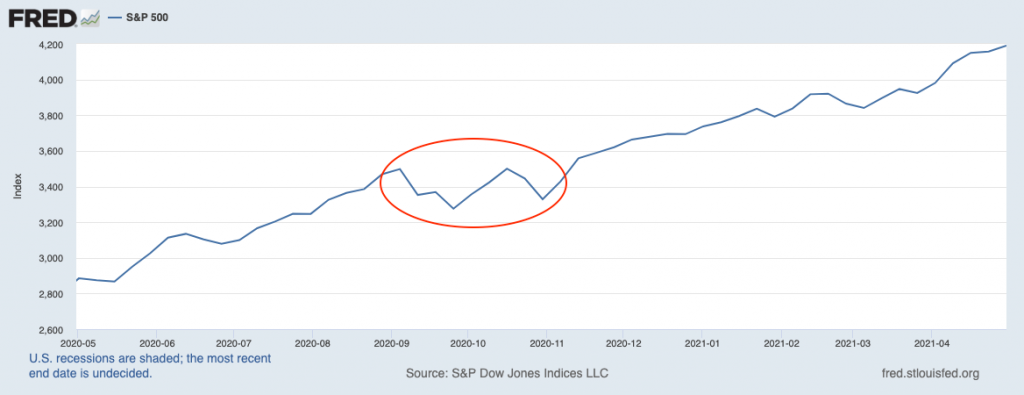
Am I claiming impending doom for U.S. stocks? Of course not. My outlook for equities is still positive based on our expectation of better-than-expected earnings and growth in the new year. But in my view, it does mean now is a good time to mentally prepare for a stock market correction. And I should make one thing clear before I go any further: a pullback of -10% or more would not be cause for concern, in my view. Just the opposite – I would see a correction as a sign of a normal, healthy bull market.
Let’s take a look back at the 2008 Global Financial Crisis bear market for a good example. When the bull market started in March 2009, the S&P 500 rallied +63% from the bottom through the end of the year – very close to the +68% rally following the Covid-19 bear. In 2010, which was the second year of that bull market, the S&P 500 endured an intra-year correction of -16%. The correction was scary at the time, but also healthy – the market finished up +13% in 2010.5 We have seen this very regularly throughout history, where the second year of a bull market is choppy but also finishes positive. I could see a similar outcome in 2021.
So, how should investors prepare for market volatility or a double-digit correction? Using history as a guide, I would offer two pieces of advice:
- Mentally prepare for a correction now, so when it arrives, you expect it and can avoid making any knee-jerk, reactive decisions.
- Review your current allocation to ensure your portfolio is well-diversified, which to me usually means investing across different asset classes, styles, sizes, and even regions. A broadly diversified portfolio can ‘smooth out the ride’ during market pullbacks.
At Zacks Investment Management, these pieces of advice are already baked into our investment decision-making process and our approach. We build diversified investment portfolios for every client based on their needs and their goals, and we manage assets within the portfolio based on proprietary research derived from Zacks Investment Research. In other words, we do not leave any room for emotional, reactive decisions, which is precisely where corrections tend to drive investors.
Bottom Line for Investors
The point of talking about the possibility of a stock market correction now is not to try and predict when the correction will arrive or to make a plan for trading in-and-out of the market during it. I do not recommend doing either.
Thinking about the possibility of a stock market correction simply helps us prepare mentally for a sharp and sudden pullback so that when it arrives, it does not tempt us into some knee-jerk portfolio response. Corrections are normal, healthy features of bull markets and equity investing in general. We should treat them as such.
So instead of living in fear of a correction and potentially making knee-jerk, emotional decisions as a result, prepare your investments for the long-term by focusing on key data points and economic indicators that could positively impact your investments in the future.
To help you do this, I am offering all readers our Just-Released May 2021 Stock Market Outlook Report.
This report looks at several factors that are producing optimism right now and contains some of our key forecasts to consider such as:
- Zacks Rank S&P 500 Sector Picks
- Economic expectations for the rest of the year
- Zacks May view on equity markets
- A look at the Covid-19 vaccine tracker update
- A look at U.S. returns expectations for 2021
- What produces 2021 optimism?
- Sell-side and buy-side consensus
- And much more
If you have $500,000 or more to invest and want to learn more about these forecasts, click on the link below to get your free report today!
Disclosure
2 J.P.Morgan. Guide to the Markets. April 30, 2021. https://am.jpmorgan.com/us/en/asset-management/adv/insights/market-insights/guide-to-the-markets/
3 Zacks Investment Management reserves the right to amend the terms or rescind the free Stock Market Outlook offer at any time and for any reason at its discretion.
4 Fred Economic Data. May 3, 2021. https://fred.stlouisfed.org/series/SP500#0
5 Morgan Stanley. February 5, 2021. https://www.morganstanley.com/ideas/stock-market-outlook-2021
6 Zacks Investment Management reserves the right to amend the terms or rescind the free Stock Market Outlook offer at any time and for any reason at its discretion.
DISCLOSURE
Past performance is no guarantee of future results. Inherent in any investment is the potential for loss.
Zacks Investment Management, Inc. is a wholly-owned subsidiary of Zacks Investment Research. Zacks Investment Management is an independent Registered Investment Advisory firm and acts as an investment manager for individuals and institutions. Zacks Investment Research is a provider of earnings data and other financial data to institutions and to individuals.
This material is being provided for informational purposes only and nothing herein constitutes investment, legal, accounting or tax advice, or a recommendation to buy, sell or hold a security. Do not act or rely upon the information and advice given in this publication without seeking the services of competent and professional legal, tax, or accounting counsel. Publication and distribution of this article is not intended to create, and the information contained herein does not constitute, an attorney-client relationship. No recommendation or advice is being given as to whether any investment or strategy is suitable for a particular investor. It should not be assumed that any investments in securities, companies, sectors or markets identified and described were or will be profitable. All information is current as of the date of herein and is subject to change without notice. Any views or opinions expressed may not reflect those of the firm as a whole.
Any projections, targets, or estimates in this report are forward looking statements and are based on the firm’s research, analysis, and assumptions. Due to rapidly changing market conditions and the complexity of investment decisions, supplemental information and other sources may be required to make informed investment decisions based on your individual investment objectives and suitability specifications. All expressions of opinions are subject to change without notice. Clients should seek financial advice regarding the appropriateness of investing in any security or investment strategy discussed in this presentation.
Certain economic and market information contained herein has been obtained from published sources prepared by other parties. Zacks Investment Management does not assume any responsibility for the accuracy or completeness of such information. Further, no third party has assumed responsibility for independently verifying the information contained herein and accordingly no such persons make any representations with respect to the accuracy, completeness or reasonableness of the information provided herein. Unless otherwise indicated, market analysis and conclusions are based upon opinions or assumptions that Zacks Investment Management considers to be reasonable. Any investment inherently involves a high degree of risk, beyond any specific risks discussed herein.
The S&P 500 Index is a well-known, unmanaged index of the prices of 500 large-company common stocks, mainly blue-chip stocks, selected by Standard & Poor’s. The S&P 500 Index assumes reinvestment of dividends but does not reflect advisory fees. The volatility of the benchmark may be materially different from the individual performance obtained by a specific investor. An investor cannot invest directly in an index.
The Russell 1000 Growth Index is a well-known, unmanaged index of the prices of 1000 large-company growth common stocks selected by Russell. The Russell 1000 Growth Index assumes reinvestment of dividends but does not reflect advisory fees. An investor cannot invest directly in an index. The volatility of the benchmark may be materially different from the individual performance obtained by a specific investor.
Nasdaq Composite Index is the market capitalization-weighted index of over 3,300 common equities listed on the Nasdaq stock exchange. The types of securities in the index include American depositary receipts, common stocks, real estate investment trusts (REITs) and tracking stocks, as well as limited partnership interests. The index includes all Nasdaq-listed stocks that are not derivatives, preferred shares, funds, exchange-traded funds (ETFs) or debenture securities. An investor cannot invest directly in an index. The volatility of the benchmark may be materially different from the individual performance obtained by a specific investor.
“The Dow Jones Industrial Average measures the daily stock market movements of 30 U.S. publicly-traded companies listed on the NASDAQ or the New York Stock Exchange (NYSE). The 30 publicly-owned companies are considered leaders in the United States economy. An investor cannot directly invest in an index. The volatility of the benchmark may be materially different from the individual performance obtained by a specific investor.”