Non-U.S. stocks have been in rally mode.
In the three months ending January 31, foreign stocks as measured by the MSCI ACWI ex-U.S. index have risen over +18%, while the S&P 500 index is up a much lesser ~4% over the same period. Foreign stocks widely underperformed U.S. stocks in the last bull cycle, so investors are naturally wondering if a trend reversal is underway.1
I’ll dig more into that question below. But first, let’s take a quick look at what’s driving recent foreign outperformance.2
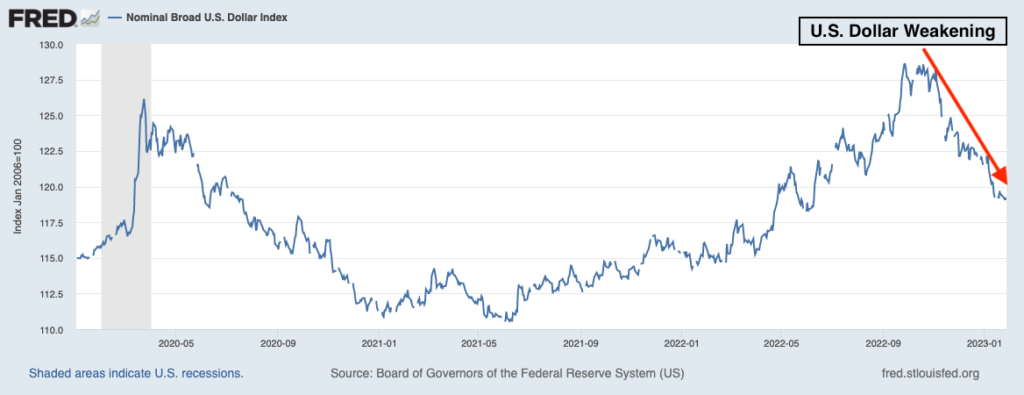
One key driver has been the U.S. dollar. It is no coincidence that over the same period of time that foreign returns have been far outstripping U.S. returns, the U.S. dollar has weakened significantly from peaks. A weaker dollar means that foreign stocks will fetch more dollars once they are converted from their home currency, which increases their value. And compared to a basket of other developed foreign currencies, the dollar has fallen to June 2022 levels as seen in the chart below:
Should You Be Bullish? Get the Answer with Our Just-Released Report!
Instead of basing your investment decisions on worrisome headlines, I recommend focusing on fundamental drivers. To help you do this, I am offering all readers our just-released Stock Market Outlook report. This report contains some of our key forecasts to consider such as:
- Setting U.S. return expectations for 2023
- Zacks forecasts at a glance
- What produces 2023 optimism?
- What’s alive for 2023 pessimists?
- Is it time to buy stocks?
- And more…
If you have $500,000 or more to invest and want to learn more about these forecasts, click on the link below to get your free report today!
IT’S FREE. Download the Just-Released February 2023 Stock Market Outlook3
Nominal Broad U.S. Dollar Index
Another reason for U.S. underperformance relative to foreign has to do with technology weighting. Tighter financial conditions and higher interest rates have led investors to shun high P/E growth stocks, many of which reside in the technology sector. At the end of 2022, technology stocks made up about 26% of the S&P 500, compared to about 11% of the MSCI ACWI ex-U.S. index. In recent months, technology has not served as a major drag on foreign returns as they have in the U.S.
Finally, there are fundamental drivers that have made foreign stocks – particularly in Europe – attractive relative to the U.S.
Heading into winter, there were acute fears that gas rationing and mandated industrial shutdowns across Europe – a byproduct of the war in Ukraine – would have a severe impact on economic output. In the fall, credit and equity markets were pricing-in weaker earnings and potential defaults.
But in a classic “not as bad as feared” scenario, Europe was able to obtain sufficient natural gas supplies from other countries and trading partners; enact fiscal policies to provide consumers relief; encourage households and businesses to curb consumption; and in a positive surprise, experienced warmer winter weather which helped keep demand at reasonable levels. All told, Europe expanded when most thought it would contract, delivering upside surprises across key metrics like consumption and wage growth.
And not only did Europe grow in 2022, it expanded at a faster pace than the U.S. and China – the first time that’s happened since 1974. The currency bloc known as the eurozone posted 3.5% GDP growth for 2022, which outpaced the U.S.’s 2.1% and China’s 3% growth. This outcome surprised investors accustomed to seeing China lead, followed by the U.S., with Europe usually struggling to keep up.
Stronger growth has combined with attractive valuations to drive strong relative performance over the past few months, in my view. In January, the S&P 500 traded at approximately 17x forward earnings for 2023, which is notably higher than the STOXX Europe 600’s 13x multiple and Hong Kong’s 10x multiple (using local currencies). If global growth rebounds towards the second half of 2023, led by China’s economic reopening (in my view), there could be more runway for foreign stocks to continue performing well relative to the U.S.
Bottom Line for Investors
Over the past 10+ years, U.S. stocks as measured by the MSCI USA have greatly outperformed foreign stocks as measured by the MSCI EAFE. Cumulatively, the outperformance of U.S. over foreign has been +212% from the beginning of the 2009 bull market through the end of last year – a fairly staggering figure.
But we also know that over the past 50 years, leadership between the U.S. and foreign has changed hands 10 times. One category does not outperform the other for all time. The Federal Reserve is nearing the end of its interest rate hike campaign, while the European Central Bank likely has several hikes yet to go. China’s economic reopening will likely thrust it back into the lead in terms of annual growth in 2023, but U.S. stocks could come back into favor as the peak in the interest rate cycle becomes clearer. Time will tell where leadership emerges, but in my view, the bottom line is that the global economic growth outlook is improving – not getting worse. With this outlook, I think owning a globally diversified portfolio of equities makes sense for growth investors.
To help investors focus on data that can better impact their investments this year, I am offering all readers our Just-Released February 2023 Stock Market Outlook Report. This report will provide you with key forecasts along with additional factors to consider, such as:
- Setting U.S. return expectations for 2023
- Zacks forecasts at a glance
- What produces 2023 optimism?
- What’s alive for 2023 pessimists?
- Is it time to buy stocks?
- And more…
If you have $500,000 or more to invest and want to learn more about these forecasts, click on the link below to get your free report today!
Disclosure
2 Wall Street Journal. 2023. https://www.wsj.com/articles/international-stocks-outperform-u-s-peers-11673960021
3 Fred Economic Data. January 30, 2023. https://fred.stlouisfed.org/series/DTWEXBGS#
DISCLOSURE Past performance is no guarantee of future results. Inherent in any investment is the potential for loss.
Zacks Investment Management, Inc. is a wholly-owned subsidiary of Zacks Investment Research. Zacks Investment Management is an independent Registered Investment Advisory firm and acts as an investment manager for individuals and institutions. Zacks Investment Research is a provider of earnings data and other financial data to institutions and to individuals. This material is being provided for informational purposes only and nothing herein constitutes investment, legal, accounting or tax advice, or a recommendation to buy, sell or hold a security. Do not act or rely upon the information and advice given in this publication without seeking the services of competent and professional legal, tax, or accounting counsel. Publication and distribution of this article is not intended to create, and the information contained herein does not constitute, an attorney-client relationship. No recommendation or advice is being given as to whether any investment or strategy is suitable for a particular investor. It should not be assumed that any investments in securities, companies, sectors or markets identified and described were or will be profitable. All information is current as of the date of herein and is subject to change without notice. Any views or opinions expressed may not reflect those of the firm as a whole. Any projections, targets, or estimates in this report are forward looking statements and are based on the firm’s research, analysis, and assumptions. Due to rapidly changing market conditions and the complexity of investment decisions, supplemental information and other sources may be required to make informed investment decisions based on your individual investment objectives and suitability specifications. All expressions of opinions are subject to change without notice. Clients should seek financial advice regarding the appropriateness of investing in any security or investment strategy discussed in this presentation. Certain economic and market information contained herein has been obtained from published sources prepared by other parties. Zacks Investment Management does not assume any responsibility for the accuracy or completeness of such information. Further, no third party has assumed responsibility for independently verifying the information contained herein and accordingly no such persons make any representations with respect to the accuracy, completeness or reasonableness of the information provided herein. Unless otherwise indicated, market analysis and conclusions are based upon opinions or assumptions that Zacks Investment Management considers to be reasonable. Any investment inherently involves a high degree of risk, beyond any specific risks discussed herein.
The S&P 500 Index is a well-known, unmanaged index of the prices of 500 large-company common stocks, mainly blue-chip stocks, selected by Standard & Poor’s. The S&P 500 Index assumes reinvestment of dividends but does not reflect advisory fees. The volatility of the benchmark may be materially different from the individual performance obtained by a specific investor. An investor cannot invest directly in an index.
The Russell 1000 Growth Index is a well-known, unmanaged index of the prices of 1000 large-company growth common stocks selected by Russell. The Russell 1000 Growth Index assumes reinvestment of dividends but does not reflect advisory fees. An investor cannot invest directly in an index. The volatility of the benchmark may be materially different from the individual performance obtained by a specific investor.
Nasdaq Composite Index is the market capitalization-weighted index of over 3,300 common equities listed on the Nasdaq stock exchange. The types of securities in the index include American depositary receipts, common stocks, real estate investment trusts (REITs) and tracking stocks, as well as limited partnership interests. The index includes all Nasdaq-listed stocks that are not derivatives, preferred shares, funds, exchange-traded funds (ETFs) or debenture securities. An investor cannot invest directly in an index. The volatility of the benchmark may be materially different from the individual performance obtained by a specific investor.
The Dow Jones Industrial Average measures the daily stock market movements of 30 U.S. publicly-traded companies listed on the NASDAQ or the New York Stock Exchange (NYSE). The 30 publicly-owned companies are considered leaders in the United States economy. An investor cannot directly invest in an index. The volatility of the benchmark may be materially different from the individual performance obtained by a specific investor.
The Bloomberg Global Aggregate Index is a flagship measure of global investment grade debt from twenty-four local currency markets. This multi-currency benchmark includes treasury, government-related, corporate and securitized fixed-rate bonds from both developed and emerging markets issuers. An investor cannot invest directly in an index. The volatility of the benchmark may be materially different from the individual performance obtained by a specific investor.
The ICE Exchange-Listed Fixed & Adjustable Rate Preferred Securities Index is a modified market capitalization weighted index composed of preferred stock and securities that are functionally equivalent to preferred stock including, but not limited to, depositary preferred securities, perpetual subordinated debt and certain securities issued by banks and other financial institutions that are eligible for capital treatment with respect to such instruments akin to that received for issuance of straight preferred stock. An investor cannot invest directly in an index. The volatility of the benchmark may be materially different from the individual performance obtained by a specific investor.
The MSCI ACWI ex U.S. Index captures large and mid-cap representation across 22 of 23 Developed Markets (DM) countries (excluding the United States) and 24 Emerging Markets (EM) countries. The index covers approximately 85% of the global equity opportunity set outside the US. An investor cannot invest directly in an index. The volatility of the benchmark may be materially different from the individual performance obtained by a specific investor.