The U.S. dollar has been sliding for the last several months, posting its weakest start to a year since 2018. Headlines suggest the “air coming out of the dollar” is bad news for investors and an ominous sign for the U.S. economy. But I’d encourage investors to zoom out and think about the relative strength/weakness of the U.S. dollar over the past few years, not the past few months.1
Looking back just two years, many will recall that 2021 and 2022 were very strong years for the U.S. dollar. A country’s currency tends to strengthen when its economic prospects are strong relative to other countries (2021), and/or when interest rates are going up (2022). The U.S. led most of the world in economic re-opening in 2021, and the Federal Reserve was ahead of other central banks in raising rates aggressively in 2022 to combat inflation. The dollar’s strength over these periods made sense, sending the greenback to multi-decade highs against the euro, yen, and other currencies.
Fast-forward to the present day, and the economic growth and interest rate setup have shifted. The Federal Reserve appears poised to pause its rate-hike campaign sometime this summer, while other global central banks continue to raise rates. From an economic growth perspective, the U.S. economy is expected to lag Europe, China, and other Emerging Markets this year, with many investors forecasting a U.S. recession by the end of the year. Stress in the U.S. banking sector has only added to concerns about U.S. growth, and another showdown over the debt ceiling likely isn’t helping matters, either.
Instead of Timing the Market, Focus on Key Data
What does the weakening of the U.S. dollar mean for investors? Amongst the many lessons that can be learned from the economy’s ups and downs, the most important lesson is to not time the market.
Instead, I recommend focusing on key data points. To help, I’m offering our just-released May Stock Market Outlook Report. This report will give you access to our forecasts for the months ahead and insight into where to invest. You’ll also get insight on:
- U.S. macro-outlook from San Fran Fed
- Status of energy markets
- What produces 2023 optimism
- What’s alive for 2023 pessimists
- And more…
If you have $500,000 or more to invest and want to learn more about these forecasts, click on the link below to get your free report today!
Download Our Just-Released May 2023 Stock Market Outlook Report2
Taken together, these factors have all translated into a weaker dollar since last October:
The U.S. Dollar Strengthened Considerably in 2021 and 2022, But is Retreating Today
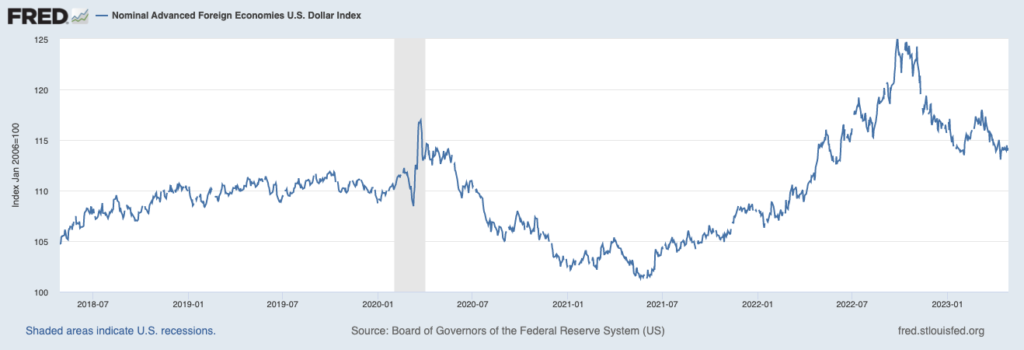
Source: Federal Reserve Bank of St. Louis3
Should investors be concerned about a slipping dollar? From an equity markets perspective, history suggests the answer is not a straightforward yes or no. The chart below shows the nominal broad U.S. dollar index for the last 15 years. The red arrows I’ve placed on the chart indicate periods when the U.S. dollar weakened over a long stretch of time, basically from late 2009 – 2011, 2017, 2020 – 2021, and year-to-date 2023. During all these periods, stocks performed quite well.
The Stock Market Has Rallied During Previous U.S. Dollar Weakening Periods
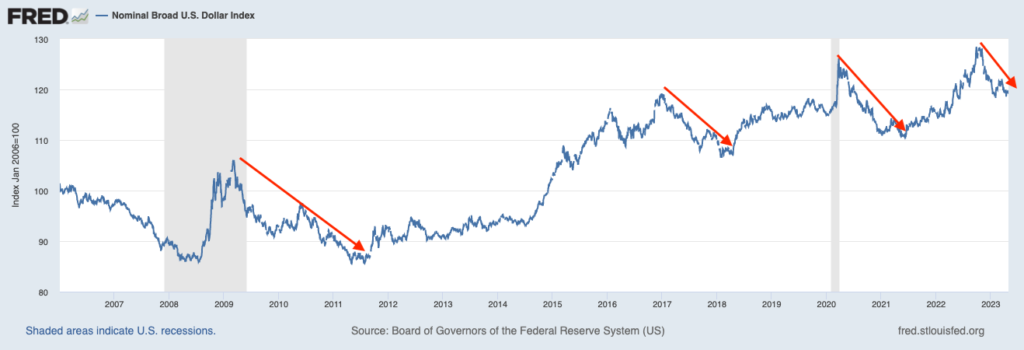
Source: Federal Reserve Bank of St. Louis4
To be clear, I am not arguing that a weaker dollar is inherently good for stocks. My point is rather to show that stocks can perform well during periods when the U.S. dollar is strengthening or weakening, which is why the market implications are not straightforward bullish or bearish. Market performance depends on too many other factors.
There are some economic implications of a weaker dollar worth mentioning, however. A weaker dollar means some foreign consumers and governments get more dollars for every unit of their home currency, which means they can afford to buy more goods and services from U.S. companies. Additionally, when profits generated in a foreign currency get translated back into a weaker U.S. dollar, it means earnings get a boost – also a positive.
The global economy tends to benefit from a weaker dollar as well. A weaker dollar can boost global trade for the reasons cited above, and foreign companies and governments with dollar debt (especially Emerging Markets) experience a lower cost of servicing and repaying their debt, which can help remove a headwind to growth.
Bottom Line for Investors
A strengthening dollar historically corresponded with one of the best periods for stocks, 1995 – 2000, but also one of the worst: the 2008 bear market. At the same time, the dollar’s weakening period from 2003 – 2006 did not adversely impact the economic expansion and stock market recovery, nor did it derail the economic and market recovery following the 2008 Global Financial Crisis or the 2020 Covid-19 pandemic.
Broadly speaking, the stock market has done very well when the dollar was strengthening and weakening, and vice versa. There is no significant correlation between the two, which means the relative strength or weakness of the dollar is not a reliable indicator for investors. In other words, even if we knew where the dollar was headed in the future, it would not offer great help in measuring the strength of the U.S. or global economy, and it certainly would not be a powerful forecasting tool for the direction of stocks.
Instead of turning to the dollar for forecasting advice, I recommend keeping an eye on key data points and fundamentals that could have an impact on the market. To help you do this, I recommend reading our Just-Released May 2023 Stock Market Outlook Report. This report will give you deeper insight into the following:
- U.S. macro-outlook from San Fran Fed
- Status of energy markets
- What produces 2023 optimism
- What’s alive for 2023 pessimists
- And more…
If you have $500,000 or more to invest and want to learn more about these forecasts, click on the link below to get your free report today!
Download Our Just-Released May 2023 Stock Market Outlook Report5
Disclosure
2 Zacks Investment Management reserves the right to amend the terms or rescind the free-Stock Market Outlook Report offer at any time and for any reason at its discretion.
3 Fred Economic Data. May 1, 2023. https://fred.stlouisfed.org/series/DTWEXAFEGS#
4 Fred Economic Data. May 1, 2023. https://fred.stlouisfed.org/series/DTWEXBGS#
5 Zacks Investment Management reserves the right to amend the terms or rescind the free-Stock Market Outlook Report offer at any time and for any reason at its discretion.
DISCLOSURE
Past performance is no guarantee of future results. Inherent in any investment is the potential for loss.
Zacks Investment Management, Inc. is a wholly-owned subsidiary of Zacks Investment Research. Zacks Investment Management is an independent Registered Investment Advisory firm and acts as an investment manager for individuals and institutions. Zacks Investment Research is a provider of earnings data and other financial data to institutions and to individuals.
This material is being provided for informational purposes only and nothing herein constitutes investment, legal, accounting or tax advice, or a recommendation to buy, sell or hold a security. Do not act or rely upon the information and advice given in this publication without seeking the services of competent and professional legal, tax, or accounting counsel. Publication and distribution of this article is not intended to create, and the information contained herein does not constitute, an attorney-client relationship. No recommendation or advice is being given as to whether any investment or strategy is suitable for a particular investor. It should not be assumed that any investments in securities, companies, sectors or markets identified and described were or will be profitable. All information is current as of the date of herein and is subject to change without notice. Any views or opinions expressed may not reflect those of the firm as a whole.
Any projections, targets, or estimates in this report are forward looking statements and are based on the firm’s research, analysis, and assumptions. Due to rapidly changing market conditions and the complexity of investment decisions, supplemental information and other sources may be required to make informed investment decisions based on your individual investment objectives and suitability specifications. All expressions of opinions are subject to change without notice. Clients should seek financial advice regarding the appropriateness of investing in any security or investment strategy discussed in this presentation.
Certain economic and market information contained herein has been obtained from published sources prepared by other parties. Zacks Investment Management does not assume any responsibility for the accuracy or completeness of such information. Further, no third party has assumed responsibility for independently verifying the information contained herein and accordingly no such persons make any representations with respect to the accuracy, completeness or reasonableness of the information provided herein. Unless otherwise indicated, market analysis and conclusions are based upon opinions or assumptions that Zacks Investment Management considers to be reasonable. Any investment inherently involves a high degree of risk, beyond any specific risks discussed herein.
The S&P 500 Index is a well-known, unmanaged index of the prices of 500 large-company common stocks, mainly blue-chip stocks, selected by Standard & Poor’s. The S&P 500 Index assumes reinvestment of dividends but does not reflect advisory fees. The volatility of the benchmark may be materially different from the individual performance obtained by a specific investor. An investor cannot invest directly in an index.
The Russell 1000 Growth Index is a well-known, unmanaged index of the prices of 1000 large-company growth common stocks selected by Russell. The Russell 1000 Growth Index assumes reinvestment of dividends but does not reflect advisory fees. An investor cannot invest directly in an index. The volatility of the benchmark may be materially different from the individual performance obtained by a specific investor.
Nasdaq Composite Index is the market capitalization-weighted index of over 3,300 common equities listed on the Nasdaq stock exchange. The types of securities in the index include American depositary receipts, common stocks, real estate investment trusts (REITs) and tracking stocks, as well as limited partnership interests. The index includes all Nasdaq-listed stocks that are not derivatives, preferred shares, funds, exchange-traded funds (ETFs) or debenture securities. An investor cannot invest directly in an index. The volatility of the benchmark may be materially different from the individual performance obtained by a specific investor.
The Dow Jones Industrial Average measures the daily stock market movements of 30 U.S. publicly-traded companies listed on the NASDAQ or the New York Stock Exchange (NYSE). The 30 publicly-owned companies are considered leaders in the United States economy. An investor cannot directly invest in an index. The volatility of the benchmark may be materially different from the individual performance obtained by a specific investor.
The Bloomberg Global Aggregate Index is a flagship measure of global investment grade debt from twenty-four local currency markets. This multi-currency benchmark includes treasury, government-related, corporate and securitized fixed-rate bonds from both developed and emerging markets issuers. An investor cannot invest directly in an index. The volatility of the benchmark may be materially different from the individual performance obtained by a specific investor.
The ICE Exchange-Listed Fixed & Adjustable Rate Preferred Securities Index is a modified market capitalization weighted index composed of preferred stock and securities that are functionally equivalent to preferred stock including, but not limited to, depositary preferred securities, perpetual subordinated debt and certain securities issued by banks and other financial institutions that are eligible for capital treatment with respect to such instruments akin to that received for issuance of straight preferred stock. An investor cannot invest directly in an index. The volatility of the benchmark may be materially different from the individual performance obtained by a specific investor.
The MSCI ACWI ex U.S. Index captures large and mid-cap representation across 22 of 23 Developed Markets (DM) countries (excluding the United States) and 24 Emerging Markets (EM) countries. The index covers approximately 85% of the global equity opportunity set outside the U.S. An investor cannot invest directly in an index. The volatility of the benchmark may be materially different from the individual performance obtained by a specific investor.