Tech’s Wild Ride and the Case for Diversification
The past few weeks have marked a volatile stretch for technology stocks—in both directions.
In July, several AI-related sub-sectors like semiconductors, memory, chips, and AI infrastructure came under intense selling pressure. The Philadelphia Semiconductor Index, for instance, nearly entered bear market territory in July, with every member of the index trading below its 50-day moving average.
Readers may have also seen stories on SK Hynix, which embodied the scale of the volatility. The company had just completed a blockbuster Nasdaq debut, raising more than $26 billion. But shares plunged -15% in one day even after a record-breaking earnings report, with operating profit up more than 500% year-over-year. The news stories and accompanying sharp moves in select stocks were head-spinning.1
Key Strategies to Strengthen Your Retirement Portfolio
July’s market volatility served as a reminder that no single sector, theme, or investment style leads forever. Building long-term wealth isn’t about chasing the market’s hottest trend; it’s about building a diversified portfolio that can adapt as market leadership changes.
Our free Ultimate Retirement Portfolio Guide2 shows you how to build a diversified, long-term investment strategy designed to help you pursue growth while managing risk. Inside, you’ll learn:
- Accurately forecasting your retirement income needs
- The two phases of determining your asset allocation
- Developing an investment discipline that allows you to get good results over time
- Avoiding self-sabotage—what you need to know
- Plus, our views on key steps to create and maintain the ultimate retirement portfolio
If you have $500,000 or more to invest, get this guide and explore strategies to potentially secure your long-term financial future.
Get our FREE guide: 7 Secrets to Building the Ultimate DIY Retirement Portfolio2
Investors were also concerned with Google’s Q2 earnings, which had the company posting its first negative free cash flow period since becoming public. Google remains highly profitable and deeply embedded in the AI race, but the market’s reaction showed that investors are paying closer attention to the cost of staying competitive in AI, not just the potential upside.
Which brings me to the Situational Awareness story. For readers who aren’t familiar, Situational Awareness ‘was’ the hedge fund founded by a former OpenAI researcher with no previous investment experience. The fund reportedly grew from hundreds of millions of dollars to a peak of approximately $45 billion in assets in less than two years, helped by a highly concentrated bet on the AI buildout.
The strategy was characterized as “long hardware, short software,” but it was a case study in the perils of becoming over-concentrated in a hot corner of the market and using leverage to juice the bet. In brief, the fund held sizable long positions in companies tied to AI infrastructure, chips, data centers, and power demand, while shorting software companies viewed as vulnerable to AI disruption. It was a concentrated expression of a view many investors have debated: that AI infrastructure would be the biggest near-term beneficiary of the technology wave, while some incumbent software businesses could face pressure.
But in July, both sides of the trade came under pressure at once. AI-infrastructure longs fell sharply, while some software shorts rallied. That meant the portfolio was not hedged in the way investors might expect from a long/short strategy. The long positions lost money, the short positions also lost money, and leverage turned the reversal into a liquidity event.
What happened next was astonishing. Situational Awareness’ assets fell from a peak of roughly $45 billion to about $10 billion in a matter of weeks. Its portfolio value reportedly declined 67% in July, forcing the fund to sell public equity holdings, eliminate leverage, and retain primarily private investments.
It marked a loud, wild cautionary tale about the risks of trying to predict exactly how the AI story will unfold—and using too much leverage and concentration to make that bet.
The point I want to make in this week’s column is that the Situational Awareness story—and July’s broader tech volatility—was not just about one fund, one company, or one trade. In fact, investors who were not following the day-to-day action closely may have looked at the broader market and assumed conditions were relatively normal. As the chart below shows, comparing the broad Volatility Index (VIX) to the Nasdaq 100 Volatility Index, broader market volatility was contained while volatility in the Nasdaq 100 was running much hotter.
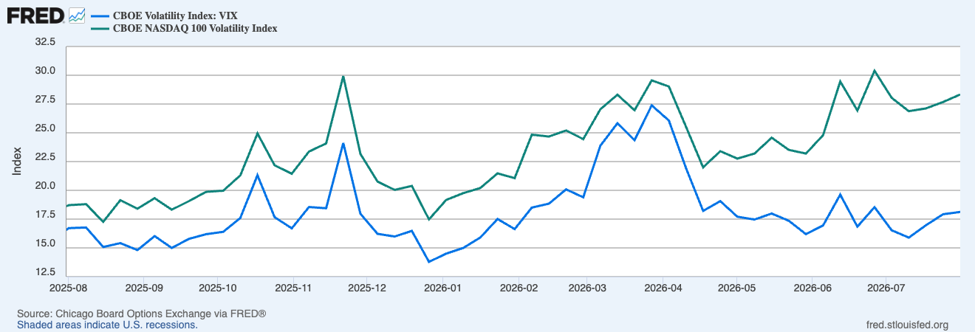
This is where diversification shows its value. Short-term noise can feel overwhelming when investors are concentrated in the part of the market generating the most headlines. But in a broader portfolio, those moves are only one part of the picture. In July, the S&P 500 was roughly flat, while sectors like Energy and Financials posted solid gains. Capital was rotating, not disappearing.
Diversification is not just about reducing exposure to volatility. It is about maintaining exposure to different sources of return when leadership shifts, so that portfolio returns can smooth out over time. Investors do not need every position, sector, or theme to generate blowout returns to make progress toward their long-term goals.
Bottom Line for Investors
The recent volatility in Tech does not negate the long-term opportunity in AI, semiconductors, software, or innovation more broadly. But it does show how difficult it can be to predict which part of a powerful theme will lead next, and it should remind investors how quickly leadership can shift.
For most investors, the goal is not to capture every upside move in the hottest corner of the market. It is to participate in long-term growth while managing the risk of being too dependent on one theme, one trade, or one moment in time. That is where diversification remains so valuable.
References to individual companies are for illustrative purposes only and should not be interpreted as recommendations to buy, sell, or hold any security.
Markets will always experience periods of uncertainty, and leadership will continue to shift over time. That’s why a disciplined investment strategy built on diversification can be one of the most effective tools for pursuing long-term financial success.
Download 7 Secrets to Building the Ultimate DIY Retirement Portfolio4 to discover practical strategies for creating a diversified portfolio designed to weather changing market conditions, including:
- Accurately forecasting your retirement income needs
- The two phases of determining your asset allocation
- Developing an investment discipline that allows you to get good results over time
- Avoiding self-sabotage—what you need to know
- Plus, our views on key steps to create and maintain the ultimate retirement portfolio
If you have $500,000 or more to invest, get this guide to learn our ideas on the step-by-step process of building and maintaining a retirement portfolio that will potentially help you reach your goals and enjoy a secure retirement.
Disclosure
2 ZIM may amend or rescind the “7 Secrets to Building the Ultimate DIY Retirement Portfolio” guide for any reason and at ZIM’s discretion.
3 Fred Economic Data. August 5, 2026. https://fred.stlouisfed.org/series/VIXCLS
4 ZIM may amend or rescind the “7 Secrets to Building the Ultimate DIY Retirement Portfolio” guide for any reason and at ZIM’s discretion.
DISCLOSURE
Past performance is no guarantee of future results. Inherent in any investment is the potential for loss.
Zacks Investment Management, Inc. is a wholly-owned subsidiary of Zacks Investment Research. Zacks Investment Management is an independent Registered Investment Advisory firm and acts as an investment manager for individuals and institutions. Zacks Investment Research is a provider of earnings data and other financial data to institutions and to individuals.
This material is being provided for informational purposes only and nothing herein constitutes investment, legal, accounting or tax advice, or a recommendation to buy, sell or hold a security. Do not act or rely upon the information and advice given in this publication without seeking the services of competent and professional legal, tax, or accounting counsel. Publication and distribution of this article is not intended to create, and the information contained herein does not constitute, an attorney-client relationship. No recommendation or advice is being given as to whether any investment or strategy is suitable for a particular investor. It should not be assumed that any investments in securities, companies, sectors or markets identified and described were or will be profitable. All information is current as of the date of herein and is subject to change without notice. Any views or opinions expressed may not reflect those of the firm as a whole.
Any projections, targets, or estimates in this report are forward looking statements and are based on the firm’s research, analysis, and assumptions. Due to rapidly changing market conditions and the complexity of investment decisions, supplemental information and other sources may be required to make informed investment decisions based on your individual investment objectives and suitability specifications. All expressions of opinions are subject to change without notice. Clients should seek financial advice regarding the appropriateness of investing in any security or investment strategy discussed in this presentation.
Certain economic and market information contained herein has been obtained from published sources prepared by other parties. Zacks Investment Management does not assume any responsibility for the accuracy or completeness of such information. Further, no third party has assumed responsibility for independently verifying the information contained herein and accordingly no such persons make any representations with respect to the accuracy, completeness or reasonableness of the information provided herein. Unless otherwise indicated, market analysis and conclusions are based upon opinions or assumptions that Zacks Investment Management considers to be reasonable. Any investment inherently involves a high degree of risk, beyond any specific risks discussed herein.
The S&P 500 Index is a well-known, unmanaged index of the prices of 500 large-company common stocks, mainly blue-chip stocks, selected by Standard & Poor’s. The S&P 500 Index assumes reinvestment of dividends but does not reflect advisory fees. The volatility of the benchmark may be materially different from the individual performance obtained by a specific investor. An investor cannot invest directly in an index.
The Russell 2000 Index is a well-known, unmanaged index of the prices of 2000 small-cap company common stocks, selected by Russell. The Russell 2000 Index assumes reinvestment of dividends but does not reflect advisory fees. An investor cannot invest directly in an index. The volatility of the benchmark may be materially different from the individual performance obtained by a specific investor.
The Nasdaq Composite Index measures all Nasdaq domestic and international based common type stocks listed on The Nasdaq Stock Market. To be eligible for inclusion in the Index, the security's U.S. listing must be exclusively on The Nasdaq Stock Market (unless the security was dually listed on another U.S. market prior to January 1, 2004 and has continuously maintained such listing). The security types eligible for the Index include common stocks, ordinary shares, ADRs, shares of beneficial interest or limited partnership interests and tracking stocks. Security types not included in the Index are closed-end funds, convertible debentures, exchange traded funds, preferred stocks, rights, warrants, units and other derivative securities. An investor cannot invest directly in an index.
The CBOE Volatility Index (VIX) is a calculation designed to produce a measure of constant, 30-day expected volatility of the U.S. stock market, derived from real-time, mid-quote prices of S&P 500 Index call and put options. On a global basis, it is one of the most recognized measures of volatility -- widely reported by financial media and closely followed by a variety of market participants as a daily market indicator. The volatility of the benchmark may be materially different from the individual performance obtained by a specific investor. An investor cannot invest directly in an index.
The NASDAQ-100 Index includes 100 of the largest domestic and international non-financial companies listed on The NASDAQ Stock Market based on market capitalization. The Index reflects companies across major industry groups including computer hardware and software, telecommunications, retail/wholesale trade and biotechnology. Index composition is reviewed on an annual basis in December. An investor cannot invest directly in an index.