In this week’s edition of Steady Investor, we break down the latest developments shaping the economic and market outlook, including:
- Consumer spending remained strong
- Fed held rates steady
- Oil volatility returned
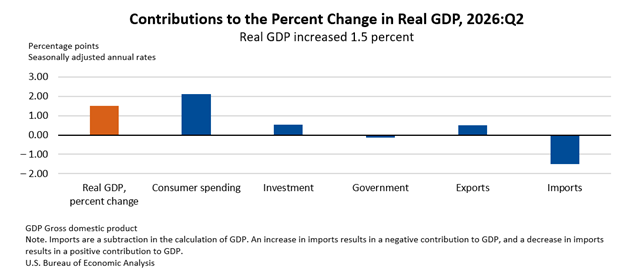
U.S. GDP Growth Slowed, but Underlying Demand Looked Stronger – U.S. economic growth slowed in the second quarter, but the headline number looked softer than some of the underlying details. Real GDP grew at a 1.5% annualized rate, according to the Commerce Department’s advance estimate, down from 2.1% in the first quarter and below economists’ expectations for 1.8% growth. Because this is the advance estimate, the figures could still be revised in the months ahead.But one detail in particular should stand out to readers: the ‘drag’ came largely from trade, with net exports subtracting about 1 percentage point from GDP. This is in part because strong demand for imported technology components like semiconductors and AI-related equipment counts against U.S. output in the GDP calculation (see chart below).1
What Today’s Market Signals Mean for Investors
Geopolitical uncertainty has returned to center stage, fueling market volatility and raising new questions for investors. While headlines can drive short-term reactions, history suggests markets often prove more resilient over the long run.
Our exclusive guide, How Geopolitical Crises Affect the Stock Market 3, shows how major events influence markets and provides perspective for your next moves.
Inside, you’ll find:
- Five significant conflicts since World War II, from Korea to Crimea
- An analysis of each conflict and its economic impacts
- U.S. GDP and S&P 500 figures for key periods of these wars
- Plus, more insights on how these crises affect the economy and market
If you have $500,000 or more to invest, request this report today!
Download Your Free Guide, How Geopolitical Crises Affect the Stock Market 3
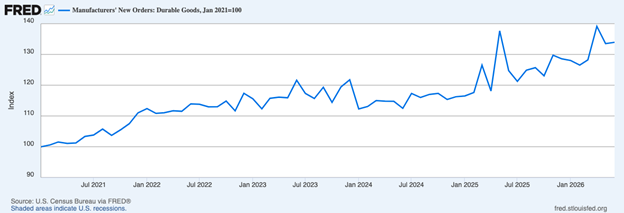
If we look past trade and think in terms of domestic-demand, economic growth looks much healthier than the 1.5% figure implies, in our view. Consumer spending rose at a 3.2% annualized pace, up sharply from 0.5% in the first quarter, despite higher gasoline prices during much of the period. Final sales to private domestic purchasers, a measure that strips out trade, inventories and government spending, rose at a 3.9% rate, the fastest pace since early 2023. Importantly, recent durable-goods data also point to continued business investment beyond just AI. New orders rose 0.3% in June, while core capital-goods orders climbed 0.9% after a 1.9% May gain. This comes on the back of broad-based gains in durable goods orders throughout this bull market, as seen below:
The Fed Didn’t Hike, But Rate Pressure is Building – The Federal Reserve held interest rates steady this week, which was broadly expected. Markets didn’t seem to like it anyway. Three Fed officials dissented in favor of raising rates, a sign that pressure for tighter policy is building.
Fed Chair Kevin Warsh seemed to make the case against hiking by suggesting that the recent rise in bond yields may already be doing some of the Fed’s work for them, by pushing borrowing costs higher across the economy. His comments come as the average 30-year fixed mortgage rate rose to 6.66%, its highest level in a year and the fourth straight weekly increase. Mortgage rates briefly fell below 6% in February, but higher Treasury yields, oil-driven inflation concerns, and uncertainty around the Fed have pushed them back up. In our view, this strengthens the case even further for the Fed’s wait-and-see approach. Though the market seems to want to price a hike in 2026, we do not see that as a high likelihood outcome.5
Oil Market Volatility is Back, But Markets are Adapting More Quickly – Oil markets remain volatile as renewed fighting in the Middle East keeps pressure on key shipping routes. Brent crude recently touched $100 a barrel before easing, then moved back above $90 as attacks resumed. That kind of swing understandably attracts attention, especially with the Strait of Hormuz normally handling about one-fifth of global oil and LNG flows.But it’s probably safe for investors to look through most of this price volatility, as markets have ‘seen this movie’ before and can likely adapt more quickly. Producers reroute exports, buyers seek alternative suppliers, shipping routes change, and higher prices can eventually pull more supply into the market or curb demand. To be sure, volatility is likely here to stay even with these adaptations, but we also see limited economic damage compared with the worst-case headlines.There is also important historical context. The U.S. economy is far less energy-intensive than it was in the 1970s, with the EIA noting that energy use per dollar of GDP has declined substantially over time.6
Navigating Markets During Geopolitical Uncertainty – Geopolitical risks, from renewed conflict in the Middle East to evolving trade policies, continue to create uncertainty and fuel market volatility.
Understanding how these events can influence markets may help investors make more informed decisions when uncertainty arises.
Download our exclusive guide, How Geopolitical Crises Affect the Stock Market7, for insights into how global events have affected investors and the key considerations for navigating periods of geopolitical uncertainty.
Inside, you’ll discover:
- Five significant conflicts since World War II, from Korea to Crimea
- An analysis of each conflict and its economic impacts
- U.S. GDP and S&P 500 figures for key periods of these wars
- Plus, more insights on how these crises affect the economy and market
If you have $500,000 or more to invest, request this report today!
Disclosure
2 BEA. July 30, 2026. https://www.bea.gov/news/2026/gdp-advance-estimate-2nd-quarter-2026
3 Zacks Investment Management reserves the right to amend the terms or rescind the free How Geopolitical Crises Affect the Stock Market offer at any time and for any reason at its discretion.
4 Fred Economic Data. July 27, 2026. https://fred.stlouisfed.org/series/DGORDER
5 Wall Street Journal. July 29, 2026. https://www.wsj.com/finance/stocks/warshs-posture-on-interest-rates-sparks-market-inflation-fears-60b9933c?mod=finance_lead_pos4
6 Wall Street Journal. July 29, 2026. https://www.wsj.com/finance/stocks/warshs-posture-on-interest-rates-sparks-market-inflation-fears-60b9933c?mod=finance_lead_pos4
7 Zacks Investment Management reserves the right to amend the terms or rescind the free How Geopolitical Crises Affect the Stock Market offer at any time and for any reason at its discretion.
DISCLOSURE
Past performance is no guarantee of future results. Inherent in any investment is the potential for loss.
Zacks Investment Management, Inc. is a wholly-owned subsidiary of Zacks Investment Research. Zacks Investment Management is an independent Registered Investment Advisory firm and acts as an investment manager for individuals and institutions. Zacks Investment Research is a provider of earnings data and other financial data to institutions and to individuals.
This material is being provided for informational purposes only and nothing herein constitutes investment, legal, accounting or tax advice, or a recommendation to buy, sell or hold a security. Do not act or rely upon the information and advice given in this publication without seeking the services of competent and professional legal, tax, or accounting counsel. Publication and distribution of this article is not intended to create, and the information contained herein does not constitute, an attorney-client relationship. No recommendation or advice is being given as to whether any investment or strategy is suitable for a particular investor. It should not be assumed that any investments in securities, companies, sectors or markets identified and described were or will be profitable. All information is current as of the date of herein and is subject to change without notice. Any views or opinions expressed may not reflect those of the firm as a whole.
Any projections, targets, or estimates in this report are forward looking statements and are based on the firm’s research, analysis, and assumptions. Due to rapidly changing market conditions and the complexity of investment decisions, supplemental information and other sources may be required to make informed investment decisions based on your individual investment objectives and suitability specifications. All expressions of opinions are subject to change without notice. Clients should seek financial advice regarding the appropriateness of investing in any security or investment strategy discussed in this presentation.
Certain economic and market information contained herein has been obtained from published sources prepared by other parties. Zacks Investment Management does not assume any responsibility for the accuracy or completeness of such information. Further, no third party has assumed responsibility for independently verifying the information contained herein and accordingly no such persons make any representations with respect to the accuracy, completeness or reasonableness of the information provided herein. Unless otherwise indicated, market analysis and conclusions are based upon opinions or assumptions that Zacks Investment Management considers to be reasonable. Any investment inherently involves a high degree of risk, beyond any specific risks discussed herein.
It is not possible to invest directly in an index. Investors pursuing a strategy similar to an index may experience higher or lower returns, which will be reduced by fees and expenses.
The S&P 500 Index is a well-known, unmanaged index of the prices of 500 large-company common stocks, mainly blue-chip stocks, selected by Standard & Poor’s. The S&P 500 Index assumes reinvestment of dividends but does not reflect advisory fees. The volatility of the benchmark may be materially different from the individual performance obtained by a specific investor. An investor cannot invest directly in an index.
The Russell 1000 Growth Index is a well-known, unmanaged index of the prices of 1000 large-company growth common stocks selected by Russell. The Russell 1000 Growth Index assumes reinvestment of dividends but does not reflect advisory fees. An investor cannot invest directly in an index. The volatility of the benchmark may be materially different from the individual performance obtained by a specific investor.
Nasdaq Composite Index is the market capitalization-weighted index of over 3,300 common equities listed on the Nasdaq stock exchange. The types of securities in the index include American depositary receipts, common stocks, real estate investment trusts (REITs) and tracking stocks, as well as limited partnership interests. The index includes all Nasdaq-listed stocks that are not derivatives, preferred shares, funds, exchange-traded funds (ETFs) or debenture securities. An investor cannot invest directly in an index. The volatility of the benchmark may be materially different from the individual performance obtained by a specific investor.
“The Dow Jones Industrial Average measures the daily stock market movements of 30 U.S. publicly-traded companies listed on the NASDAQ or the New York Stock Exchange (NYSE). The 30 publicly-owned companies are considered leaders in the United States economy. An investor cannot directly invest in an index. The volatility of the benchmark may be materially different from the individual performance obtained by a specific investor.”
Returns for each strategy and the corresponding Morningstar Universe reflect the annualized returns for the periods indicated. The Morningstar Universes used for comparative analysis are constructed by Morningstar (median performance) and data is provided to Zacks by Zephyr Style Advisor. The percentile ranking for each Zacks Strategy is based on the gross comparison for Zacks Strategies vs. the indicated universe rounded up to the nearest whole percentile. Other managers included in universe by Morningstar may exhibit style drift when compared to Zacks Investment Management portfolio. Neither Zacks Investment Management nor Zacks Investment Research has any affiliation with Morningstar. Neither Zacks Investment Management nor Zacks Investment Research had any influence of the process Morningstar used to determine this ranking.
The Russell 1000 Value Index is a well-known, unmanaged index of the prices of 1000 large-company value common stocks selected by Russell. The Russell 1000 Value Index assumes reinvestment of dividends but does not reflect advisory fees. An investor cannot directly invest in an index. The volatility of the benchmark may be materially different from the individual performance obtained by a specific investor.
Questions posed are for demonstrative and informational purposes only and may not reflect the views of current clients or any one individual.