2021 is officially on the books, and I wish all readers a happy and healthy new year. Looking back on the last year, it is easy to find plenty of twists, turns, and uncertainties. Just to name a few:
- A political crisis in the U.S. to kick off the year;
- Massive deficit spending and debt increases with $1.9 trillion Covid-19 spending package passed in March;
- Household savings and net worth soar, but increased demand for goods creates supply chain issues;
- Covid-19 pandemic continues to disrupt growth, with Delta variant significantly impacting late summer economic activity;
- S. housing market strongest in over a decade, resulting in steep increases to housing prices across the country;
- Special purpose acquisition companies (SPACs) boom in popularity early in the year, only to bust by the year’s end;
- So-called “meme stocks” go haywire in the first half, only to fizzle later in the year;
- Consumers continue to navigate public health and economic restrictions throughout the year, as the pandemic wears on;
- Inflation runs hot in the second half of the year, with prices rising faster and longer-than-expected;
- The Omicron variant arrives in time for the holidays.
Plenty more happened last year, of course. But looking at just this list, I think it is fair to say that 2021 was far from normal. If a person categorized the last year as crazy and unusual, I’d understand why.
But that wasn’t the case for stocks.
As you can see in the chart below, the smooth upward trajectory of the S&P 500 looks anything but crazy and unusual. In fact, the S&P 500 charted new highs throughout the last year without much volatility at all.
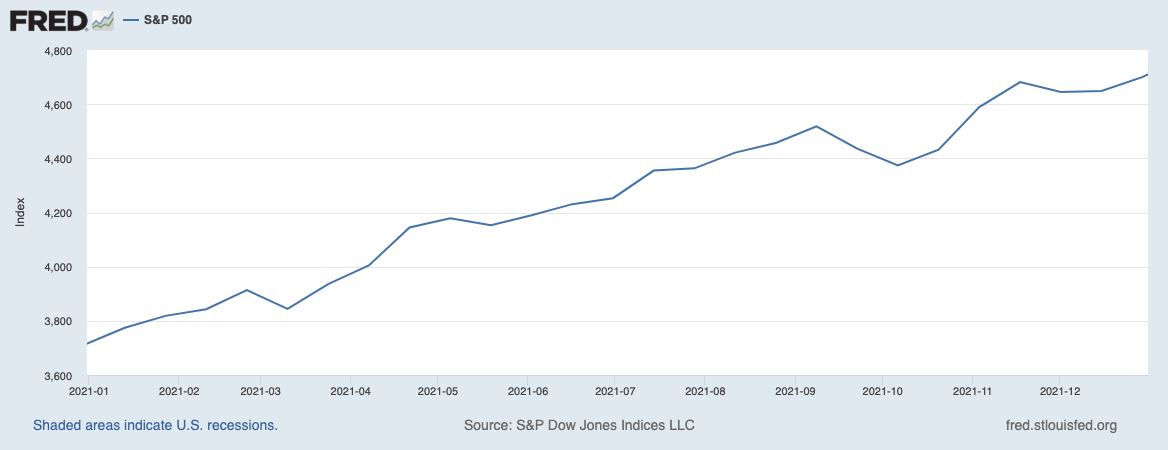
Source: Federal Reserve Bank of St. Louis1
The biggest decline for 2021 happened from September 2nd to October 4th, when the S&P 500 fell by -5.2%. A pullback earlier in the year saw the market dip by about 4%. Considering that the average intra-year correction for the S&P 500 is -14% (average from 1980 to 2021),2 investors are hopefully cheering the relatively smooth ride stocks delivered in 2021. There were 109 trading days with a bigger than 1% move (up or down) in 2020. In 2021, that number fell by about half to 55.3
So, even though 2021 felt like it was filled with twists, news headlines, and crazy narratives, for well-diversified equity investors it was arguably a nice respite. Investors who stayed the course with a diversified portfolio of stocks likely experienced very average volatility with what I would consider above-average returns. Looking at just the S&P 500, stocks finished the year up +27%.4
Many in the financial media have been harping on the seeming disconnect between stocks’ performance and craziness in the news headlines. But in my view, it’s not at all crazy that stocks continued to rise even as economic sentiment soured – it’s normal. At the end of the day, corporate earnings went up while sentiment about the state of the economy continued to fall. Said another way, U.S. corporations raked-in record profits while the wall of worry rose – perhaps the most classic recipe for strong stock market performance, in my view.
Bottom Line for Investors
Looking more closely at individual stocks, sectors, and categories could easily make the case that there was plenty of volatility in the equity markets in 2021. Value stocks rallied hard relative to growth stocks in the first half of the year, only to see growth surge in the second half of the year. Energy stocks swung pretty wildly from 2020 to 2021, and many of the Technology sectors’ best names in 2020 lagged in 2021. The list goes on.
My overarching point in this week’s column, however, is that despite a year beset by uncertainties and twists, equities broadly delivered strong performance with relatively normal volatility. This outcome does not make 2021 a crazy year for stocks and the economy – it makes it a normal one, in my view. When the mood in the news is that the economy is suffering, but U.S. corporations are quietly delivering better-than-expected earnings and the economy is growing quite strongly, I would expect stocks to go up. That’s what we saw in 2021.
Disclosure
2 J.P. Morgan. Guide to the Markets Slide 16. December 31, 2021. https://am.jpmorgan.com/us/en/asset-management/adv/insights/market-insights/guide-to-the-markets/
3Fishers Investments. December 31, 2021. https://www.fisherinvestments.com/en-us/marketminder/2021-in-markets-the-wild-year-that-wasnt
4 J.P. Morgan. Guide to the Markets Slide 16. December 31, 2021. https://am.jpmorgan.com/us/en/asset-management/adv/insights/market-insights/guide-to-the-markets/
DISCLOSURE
Past performance is no guarantee of future results. Inherent in any investment is the potential for loss.
Zacks Investment Management, Inc. is a wholly-owned subsidiary of Zacks Investment Research. Zacks Investment Management is an independent Registered Investment Advisory firm and acts as an investment manager for individuals and institutions. Zacks Investment Research is a provider of earnings data and other financial data to institutions and to individuals.
This material is being provided for informational purposes only and nothing herein constitutes investment, legal, accounting or tax advice, or a recommendation to buy, sell or hold a security. Do not act or rely upon the information and advice given in this publication without seeking the services of competent and professional legal, tax, or accounting counsel. Publication and distribution of this article is not intended to create, and the information contained herein does not constitute, an attorney-client relationship. No recommendation or advice is being given as to whether any investment or strategy is suitable for a particular investor. It should not be assumed that any investments in securities, companies, sectors or markets identified and described were or will be profitable. All information is current as of the date of herein and is subject to change without notice. Any views or opinions expressed may not reflect those of the firm as a whole.
Any projections, targets, or estimates in this report are forward looking statements and are based on the firm’s research, analysis, and assumptions. Due to rapidly changing market conditions and the complexity of investment decisions, supplemental information and other sources may be required to make informed investment decisions based on your individual investment objectives and suitability specifications. All expressions of opinions are subject to change without notice. Clients should seek financial advice regarding the appropriateness of investing in any security or investment strategy discussed in this presentation.
Certain economic and market information contained herein has been obtained from published sources prepared by other parties. Zacks Investment Management does not assume any responsibility for the accuracy or completeness of such information. Further, no third party has assumed responsibility for independently verifying the information contained herein and accordingly no such persons make any representations with respect to the accuracy, completeness or reasonableness of the information provided herein. Unless otherwise indicated, market analysis and conclusions are based upon opinions or assumptions that Zacks Investment Management considers to be reasonable. Any investment inherently involves a high degree of risk, beyond any specific risks discussed herein.
The S&P 500 Index is a well-known, unmanaged index of the prices of 500 large-company common stocks, mainly blue-chip stocks, selected by Standard & Poor’s. The S&P 500 Index assumes reinvestment of dividends but does not reflect advisory fees. The volatility of the benchmark may be materially different from the individual performance obtained by a specific investor. An investor cannot invest directly in an index.
The Russell 1000 Growth Index is a well-known, unmanaged index of the prices of 1000 large-company growth common stocks selected by Russell. The Russell 1000 Growth Index assumes reinvestment of dividends but does not reflect advisory fees. An investor cannot invest directly in an index. The volatility of the benchmark may be materially different from the individual performance obtained by a specific investor.
Nasdaq Composite Index is the market capitalization-weighted index of over 3,300 common equities listed on the Nasdaq stock exchange. The types of securities in the index include American depositary receipts, common stocks, real estate investment trusts (REITs) and tracking stocks, as well as limited partnership interests. The index includes all Nasdaq-listed stocks that are not derivatives, preferred shares, funds, exchange-traded funds (ETFs) or debenture securities. An investor cannot invest directly in an index. The volatility of the benchmark may be materially different from the individual performance obtained by a specific investor.
The Dow Jones Industrial Average measures the daily stock market movements of 30 U.S. publicly-traded companies listed on the NASDAQ or the New York Stock Exchange (NYSE). The 30 publicly-owned companies are considered leaders in the United States economy. An investor cannot directly invest in an index. The volatility of the benchmark may be materially different from the individual performance obtained by a specific investor.