Making smart, informed investment decisions really involves a two-part process, in my view. The first part is looking at the macroeconomic environment – this tells you whether the global economy is generally expected to grow (i.e., whether stocks have a path higher). It means looking at metrics like GDP, inflation, interest rates, velocity of money, and geopolitics (amongst a few others).
The second part gets down to the company/asset level. Is this company expected to grow earnings in-line or above expectations? What is the company’s free cash flow and what does it do with spare cash? Is the yield on this bond high enough to compensate for the underlying risk of the company or municipality? These are all questions that we address at Zacks Investment Management.
In this post, I want to focus on the macro, and three critical factors I think investors should be watching perhaps more than any other factors out there.
1. Transports
Transports are a solid economic indicator. As cargo and freight are moving across the country and landing in ports, it is a sign that economic activity is chugging along. Freight shipments starting to slow and eventually declining quarter over quarter has portended economic recession in the past. As you can see in the chart below, there was a sharp drop-off in 2000 which preceded the dot com bust, and though it’s a bit tough to notice, there were two years of declines starting in 2006 that eventually saw a plummet in 2008.
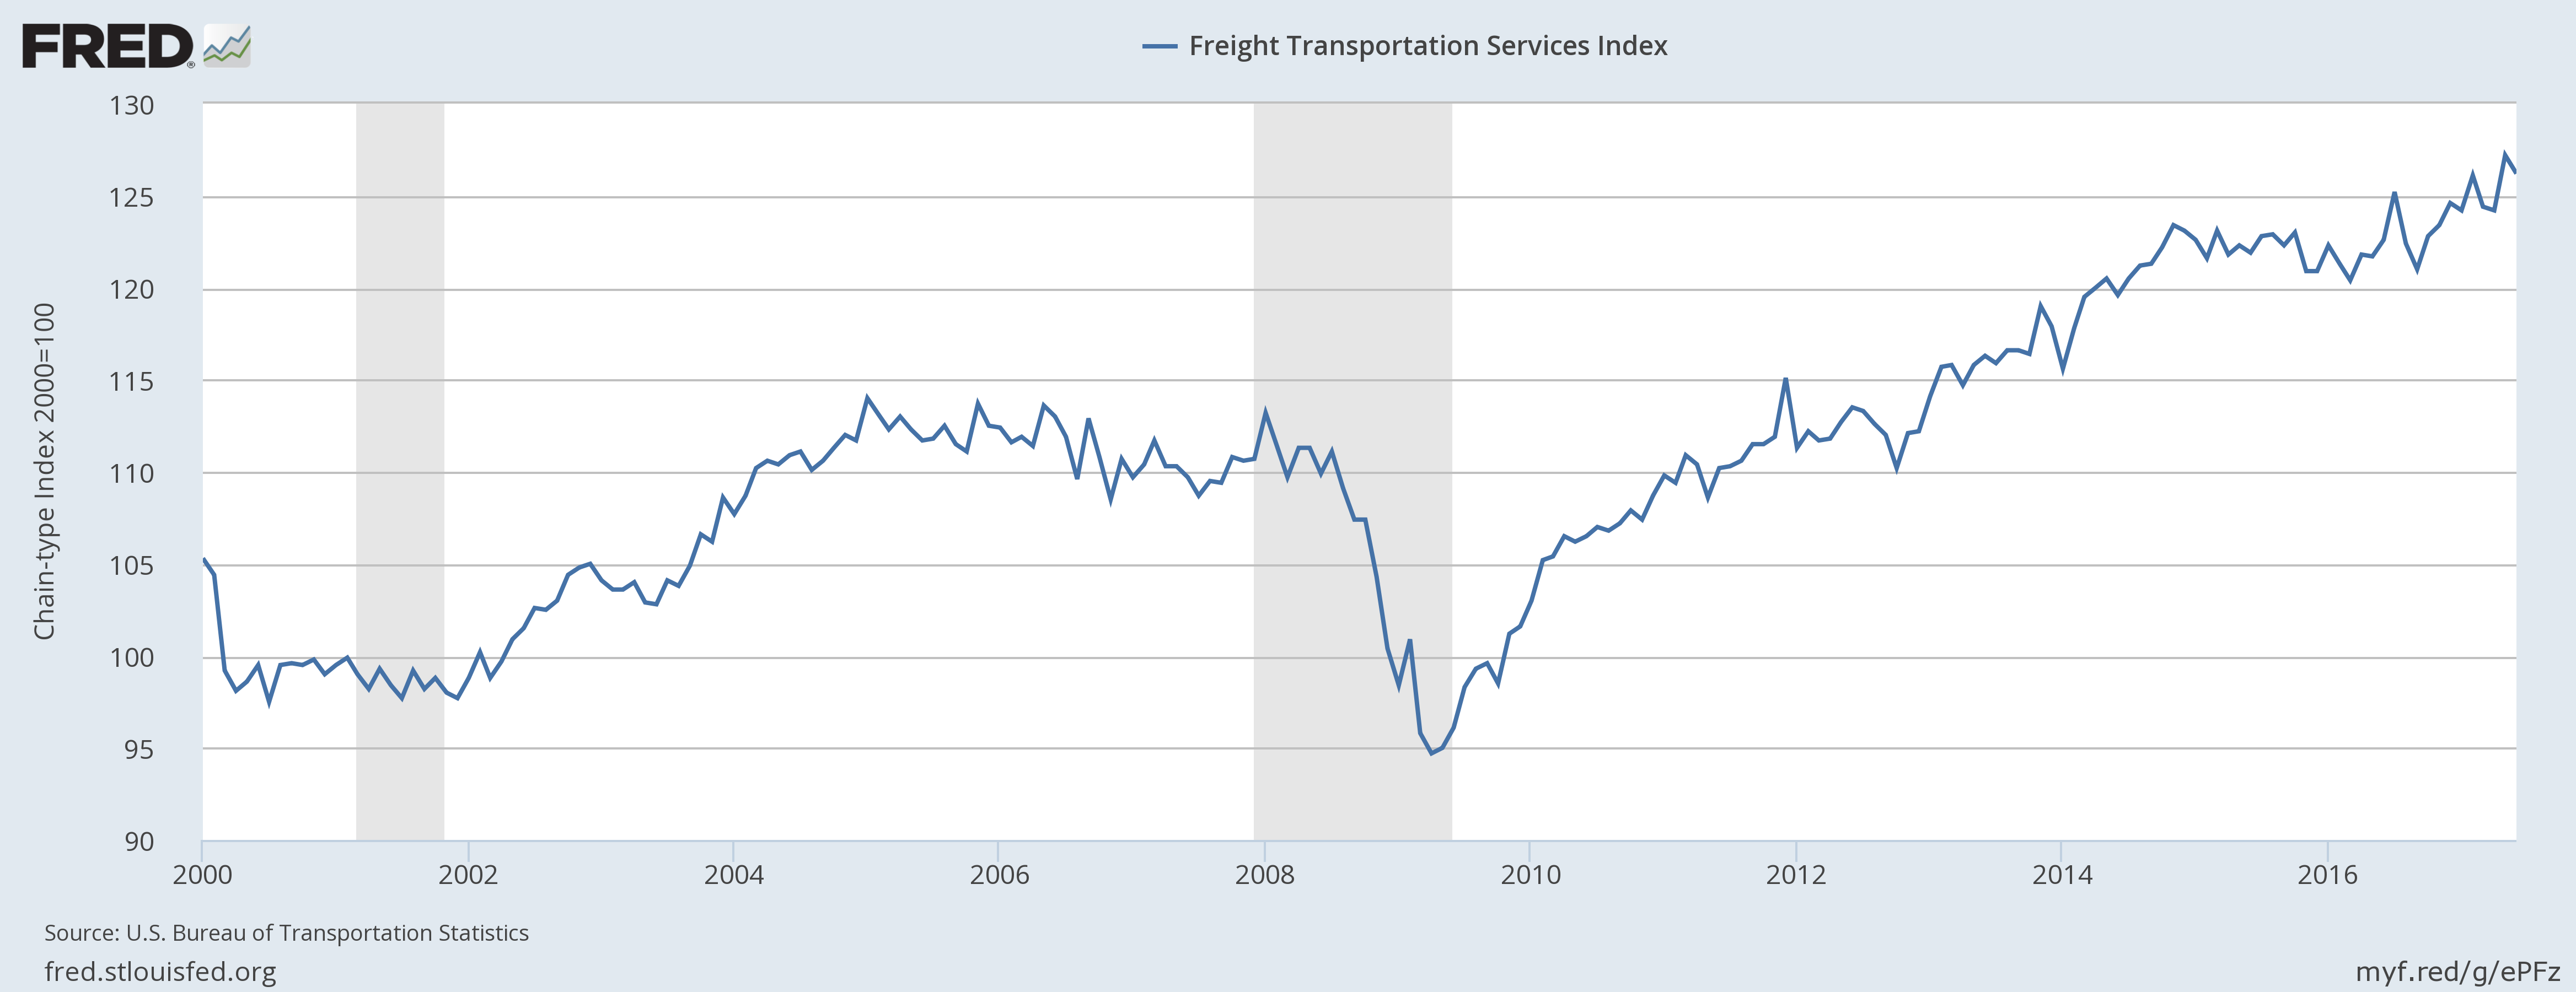
Source: Federal Reserve Bank of St. Louis
It’s easy to notice that Transports are currently rising along steadily today, which is a good sign.
The U.S. Department of Transportation’s Bureau of Transportation Statistics’ (BTS) has shown that all but one of the major freight modes grew since the recession that ended in June 2009 with rail intermodal growing the fastest, rising 50.6 percent from June 2009 (the end of the economic recession) to December 2016. Though transports are looking good now, it is important to keep checking back-in frequently.
2. Leading Economic Indicators
The Conference Board Leading Economic Index (LEI) is arguably one of the most underrated macroeconomic metrics/indicators out there. If you try to find an instance where the LEI was going up and the economy fell into a recession, you wouldn’t find one. Any time the LEI is high and rising, the economy has grown – plain and simple. It makes sense then that the key elements of the LEI are designed to signal peaks and troughs in the business cycle. It coincidentally looks at factors like manufacturers new orders, building permits, the interest rate spread, weekly claims for unemployment insurance, amongst a few others. These are all indicators that offer forward-looking insights into economic activity, versus a metric like GDP that looks backward.
As of this writing, the LEI is high and rising – another good sign, for now.
3. The Yield Curve
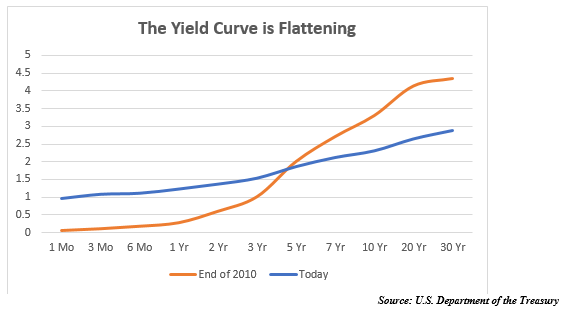
Regular readers have seen me mention the yield curve before, and I do so again to drive home its importance. A flattening yield curve generally tends to indicate that a slowdown lies ahead, and that’s exactly what we’ve been seeing over the last few years. One does not immediately follow the other, however – on average, the yield curve inverts 16 months prior to an economic recession and 13 months before major stock-market corrections. As you can see below, we are not quite to inversion yet – the blue line (today’s yield curve) is notably flatter than the orange line (the yield curve at the end of 2010). If the yield curve starts to show signs of inverting, that could be a major warning signal.
Bottom Line for Investors
The question I would challenge investors to ask themselves, is: Are you engaging in the two-part process of 1) analyzing macroeconomic factors and 2) looking at company-specific metrics day-in and day-out in your investment decision-making? If you’re falling short in either category, don’t fret it – just ask for help! We believe that Zacks Investment Management is a good place to turn. Over decades, we have developed our own databases, models, software, and completely unbiased research to create custom stock and bond portfolios, all “in-house.” That has led not only to the longevity of the company but has also placed us in the top rankings out of hundreds of equity managers in the Morningstar Equity Universe. Feel free to reach out to one of our wealth management advisors at 1-800-701-9830 to learn more about how we can help you.
Disclosure
Past performance is no guarantee of future results. Inherent in any investment is the potential for loss.
Zacks Investment Management, Inc. is a wholly-owned subsidiary of Zacks Investment Research. Zacks Investment Management is an independent Registered Investment Advisory firm and acts as an investment manager for individuals and institutions. Zacks Investment Research is a provider of earnings data and other financial data to institutions and to individuals.
This material is being provided for informational purposes only and nothing herein constitutes investment, legal, accounting or tax advice, or a recommendation to buy, sell or hold a security. Do not act or rely upon the information and advice given in this publication without seeking the services of competent and professional legal, tax, or accounting counsel. The information contained herein has been obtained from sources believed to be reliable but we do not guarantee accuracy or completeness. Publication and distribution of this article is not intended to create, and the information contained herein does not constitute, an attorney-client relationship. No recommendation or advice is being given as to whether any investment or strategy is suitable for a particular investor. It should not be assumed that any investments in securities, companies, sectors or markets identified and described were or will be profitable. All information is current as of the date of herein and is subject to change without notice. Any views or opinions expressed may not reflect those of the firm as a whole.
Returns for each strategy and the corresponding Morningstar Universe reflect the annualized returns for the periods indicated. The Morningstar Universes used for comparative analysis are constructed by Morningstar (median performance) and data is provided to Zacks by Zephyr Style Advisor. The percentile ranking for each Zacks Strategy is based on the gross comparison for Zacks Strategies vs. the indicated universe rounded up to the nearest whole percentile. Other managers included in universe by Morningstar may exhibit style drift when compared to Zacks Investment Management portfolio. Neither Zacks Investment Management nor Zacks Investment Research has any affiliation with Morningstar. Neither Zacks Investment Management nor Zacks Investment Research had any influence of the process Morningstar used to determine this ranking.