The U.S. economy grew at a faster pace in Q1 and Q2 than just about everyone expected. History and some recent data suggest it could keep growing.
In the post-World-War II era, the U.S. economy has endured 12 expansions and 13 recessions, according to data compiled by the National Bureau of Economic Research. In the decades after the war, the economy followed a familiar pattern – recessions and bear markets were cyclical, typically driven by the Fed raising rates too far to tame growth and inflation.1
But starting in the 1980s through the present day, economic expansions have lasted longer, and recessions and bear markets have largely been event-driven or structural – consider the 2001 tech bubble, the housing crisis and financial meltdown in 2008, and the pandemic. It’s worth noting that the Fed engaged in tightening campaigns in the mid-1980s and mid-1990s, but neither triggered a downturn. And stocks did well.
Looking at the graphic below, readers can see that before 1980, economic expansions were relatively short-lived (except for the 1960s). After 1981, expansions have gotten considerably longer, with the previous four lasting an average of 8.6 years. If a recession were to occur in the second half of 2023 – as many economists were and are projecting – then it would be less than half as long as the post-1981 average.
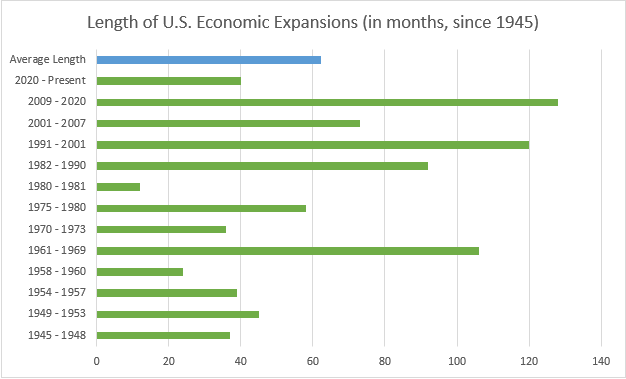
Source: National Bureau of Economic Research2
One of the key reasons expansions have become longer since the early 1980s is that inflation has not been much of an issue over the last few decades. In cycles prior to 1980, the Fed would work to choke-off economic expansions because of their objective to choke-off inflation, with the most relevant example of course being Fed Chairman Paul Volcker’s engineered recession in the early 1980s.
Just a few months ago, the narrative was that Jerome Powell’s Fed would need to follow in Volcker’s footsteps. But the thinking is starting to shift as inflation comes down meaningfully without much hint of strain in the broad U.S. economy. Consumer spending grew by a modest but still positive 1.6% in Q2, and business investment ticked nicely higher. The jobs market also continues to produce abundant openings and solid wages, which is the opposite of what we would see in a pending downturn. In Fed Chairman Powell’s words, “We’ve seen so far the beginnings of disinflation without any real costs in the labor market,” and “that’s a really good thing.”
The Fed’s Preferred Measure of Inflation Fell Below 4%
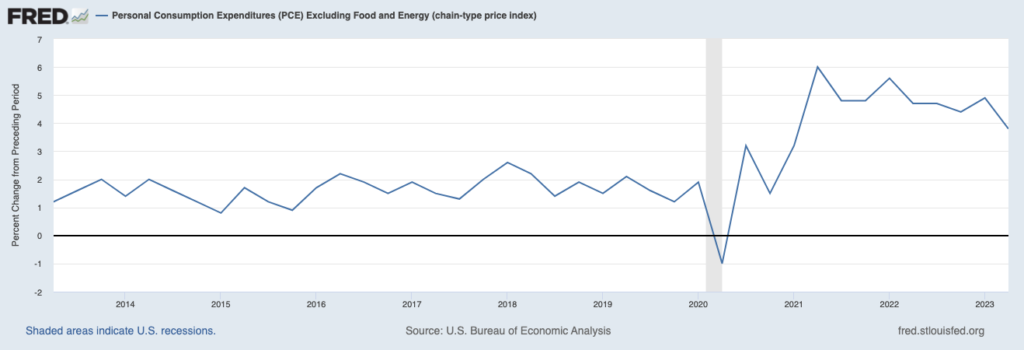
Source: Federal Reserve Bank of St. Louis3
While Job Openings Remain Abundant
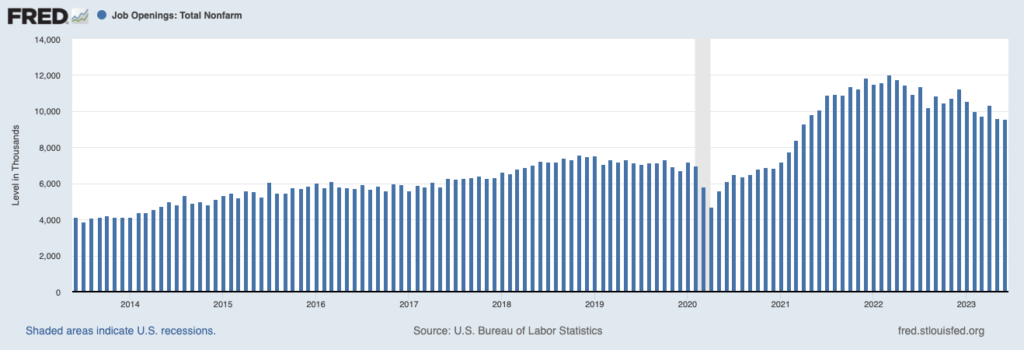
Source: Federal Reserve Bank of St. Louis4
The case for a hard landing (i.e., recession) is that the Fed today needs to do what it used to do prior to 1980, which is to engineer a recession to bring inflation down. But it looks increasingly like the Fed does not have to do that after all, which could make the current expansion look more like the previous four.
Bottom Line for Investors
When the Fed successfully raised rates in 1984 and 1994 without triggering an economic recession, the labor market was not nearly as tight as it is today. In other words, the Fed was not worried back then about wage pressures driving inflation like they are now. This might be aptly categorized as the “x-factor” that could influence the Fed to go too far in raising rates.
I’ve argued before, however, that there are several supply-side factors that could arguably neutralize any wage-price pressures, like falling producer prices, the removal of stress from global supply chains, falling shelter costs, and the plummeting of M2 money supply which tend to lead to inflation. If these other supply-side drivers effectively offset the effect of wages that are running higher than the Fed wants, then I think it’s entirely possible that the Fed will firmly conclude a recession is not needed to get inflation back down to the target. And that could give the current expansion a lot more runway from here.
Disclosure
2 National Bureau of Economic Research. March 13, 2023. https://www.nber.org/research/data/us-business-cycle-expansions-and-contractions
3 Fred Economic Data. July 27, 2023. https://fred.stlouisfed.org/series/DPCCRV1Q225SBEA#
4 Fred Economic Data. August 1, 2023. https://fred.stlouisfed.org/series/JTSJOL#
DISCLOSURE
Past performance is no guarantee of future results. Inherent in any investment is the potential for loss.
Zacks Investment Management, Inc. is a wholly-owned subsidiary of Zacks Investment Research. Zacks Investment Management is an independent Registered Investment Advisory firm and acts as an investment manager for individuals and institutions. Zacks Investment Research is a provider of earnings data and other financial data to institutions and to individuals.
This material is being provided for informational purposes only and nothing herein constitutes investment, legal, accounting or tax advice, or a recommendation to buy, sell or hold a security. Do not act or rely upon the information and advice given in this publication without seeking the services of competent and professional legal, tax, or accounting counsel. Publication and distribution of this article is not intended to create, and the information contained herein does not constitute, an attorney-client relationship. No recommendation or advice is being given as to whether any investment or strategy is suitable for a particular investor. It should not be assumed that any investments in securities, companies, sectors or markets identified and described were or will be profitable. All information is current as of the date of herein and is subject to change without notice. Any views or opinions expressed may not reflect those of the firm as a whole.
Any projections, targets, or estimates in this report are forward looking statements and are based on the firm’s research, analysis, and assumptions. Due to rapidly changing market conditions and the complexity of investment decisions, supplemental information and other sources may be required to make informed investment decisions based on your individual investment objectives and suitability specifications. All expressions of opinions are subject to change without notice. Clients should seek financial advice regarding the appropriateness of investing in any security or investment strategy discussed in this presentation.
Certain economic and market information contained herein has been obtained from published sources prepared by other parties. Zacks Investment Management does not assume any responsibility for the accuracy or completeness of such information. Further, no third party has assumed responsibility for independently verifying the information contained herein and accordingly no such persons make any representations with respect to the accuracy, completeness or reasonableness of the information provided herein. Unless otherwise indicated, market analysis and conclusions are based upon opinions or assumptions that Zacks Investment Management considers to be reasonable. Any investment inherently involves a high degree of risk, beyond any specific risks discussed herein.
The S&P 500 Index is a well-known, unmanaged index of the prices of 500 large-company common stocks, mainly blue-chip stocks, selected by Standard & Poor’s. The S&P 500 Index assumes reinvestment of dividends but does not reflect advisory fees. The volatility of the benchmark may be materially different from the individual performance obtained by a specific investor. An investor cannot invest directly in an index.
The Russell 1000 Growth Index is a well-known, unmanaged index of the prices of 1000 large-company growth common stocks selected by Russell. The Russell 1000 Growth Index assumes reinvestment of dividends but does not reflect advisory fees. An investor cannot invest directly in an index. The volatility of the benchmark may be materially different from the individual performance obtained by a specific investor.
Nasdaq Composite Index is the market capitalization-weighted index of over 3,300 common equities listed on the Nasdaq stock exchange. The types of securities in the index include American depositary receipts, common stocks, real estate investment trusts (REITs) and tracking stocks, as well as limited partnership interests. The index includes all Nasdaq-listed stocks that are not derivatives, preferred shares, funds, exchange-traded funds (ETFs) or debenture securities. An investor cannot invest directly in an index. The volatility of the benchmark may be materially different from the individual performance obtained by a specific investor.
The Dow Jones Industrial Average measures the daily stock market movements of 30 U.S. publicly-traded companies listed on the NASDAQ or the New York Stock Exchange (NYSE). The 30 publicly-owned companies are considered leaders in the United States economy. An investor cannot directly invest in an index. The volatility of the benchmark may be materially different from the individual performance obtained by a specific investor.
The Bloomberg Global Aggregate Index is a flagship measure of global investment grade debt from twenty-four local currency markets. This multi-currency benchmark includes treasury, government-related, corporate and securitized fixed-rate bonds from both developed and emerging markets issuers. An investor cannot invest directly in an index. The volatility of the benchmark may be materially different from the individual performance obtained by a specific investor.
The ICE Exchange-Listed Fixed & Adjustable Rate Preferred Securities Index is a modified market capitalization weighted index composed of preferred stock and securities that are functionally equivalent to preferred stock including, but not limited to, depositary preferred securities, perpetual subordinated debt and certain securities issued by banks and other financial institutions that are eligible for capital treatment with respect to such instruments akin to that received for issuance of straight preferred stock. An investor cannot invest directly in an index. The volatility of the benchmark may be materially different from the individual performance obtained by a specific investor.
The MSCI ACWI ex U.S. Index captures large and mid-cap representation across 22 of 23 Developed Markets (DM) countries (excluding the United States) and 24 Emerging Markets (EM) countries. The index covers approximately 85% of the global equity opportunity set outside the U.S. An investor cannot invest directly in an index. The volatility of the benchmark may be materially different from the individual performance obtained by a specific investor.
The Russell 2000 Index is a well-known, unmanaged index of the prices of 2000 small-cap company common stocks, selected by Russell. The Russell 2000 Index assumes reinvestment of dividends but does not reflect advisory fees. An investor cannot invest directly in an index. The volatility of the benchmark may be materially different from the individual performance obtained by a specific investor.
The S&P Mid Cap 400 provides investors with a benchmark for mid-sized companies. The index, which is distinct from the large-cap S&P 500, is designed to measure the performance of 400 mid-sized companies, reflecting the distinctive risk and return characteristics of this market segment.
The S&P 500 Pure Value index is a style-concentrated index designed to track the performance of stocks that exhibit the strongest value characteristics by using a style-attractiveness-weighting scheme. An investor cannot directly invest in an index. The volatility of the benchmark may be materially different from the individual performance obtained by a specific investor.