From late 2021 through September 2022, the U.S. dollar strengthened in a historic rally as the Federal Reserve aggressively raised rates and tightened monetary policy. As seen in the chart below, the big move for the dollar also corresponded with a nearly year-long bear market in stocks.1
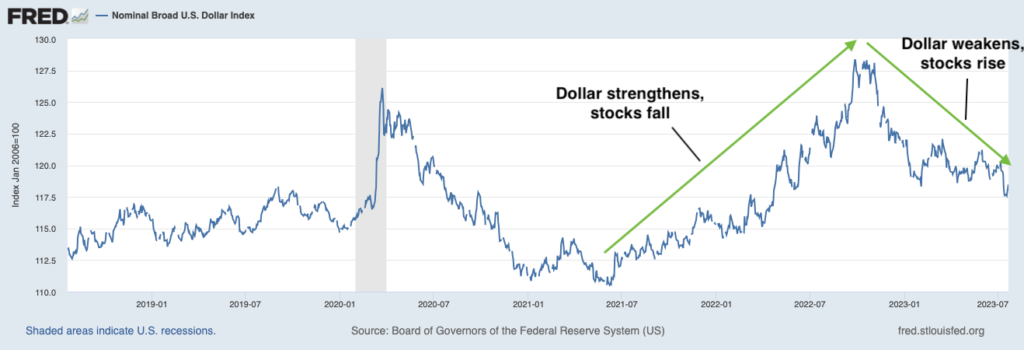
Source: Federal Reserve Bank of St. Louis2
The dollar peaked late last year, however, as the market started to anticipate an end to rate increases sometime in 2023 – which happened to align with Europe and other major central banks turning up the heat on tightening. The dollar historically weakens on lower-than-expected inflation, which describes the outcome in the U.S. but certainly not in Europe, where inflation is proving stickier.
Other events in 2023 also pressured the dollar lower. The regional bank stress spurred concern about a larger crisis in the banking system, months of debt ceiling drama led to fear of default, and for months there was broad consensus that the U.S. was charging towards a recession. As the dollar weakened, stocks rose.
Some analysts are pointing to the dollar breaking through a key support level as the driver behind the “risk-on” rally. I’m not so sure. The assumption that a weak dollar means a strong market, or vice versa, does not hold up against history. If we take the same U.S. Dollar Index chart as you see above, and zoom out to look back over the last 15 years, you can see that the dollar is strengthening (2011 – 2020) throughout one of the strongest bull markets in history:
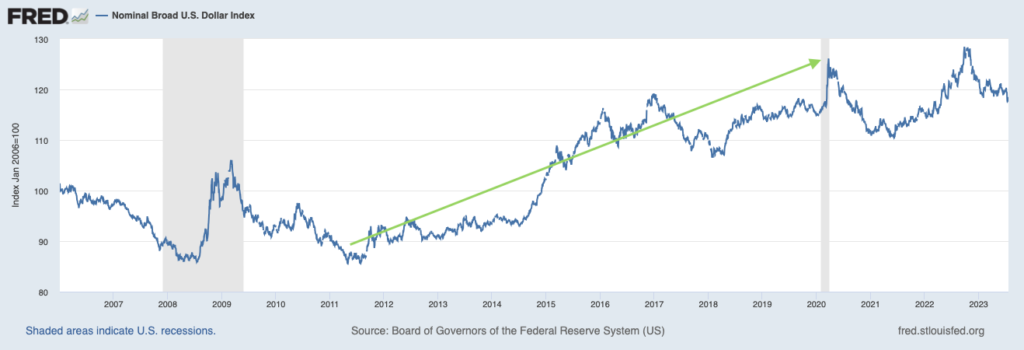
Source: Federal Reserve Bank of St. Louis3
For investors, I think the weak dollar story is about earnings.
The biggest beneficiaries of a weakening U.S. dollar are U.S. large-cap companies, namely multinationals. In many cases, multinationals can generate more than half of their revenue abroad, which means they’re being paid in euros, yen, etc. When those foreign earnings are converted back to dollars, the company naturally earns more dollars as the currency weakens. In these cases, market forces help boost profits.
To offer an example, back in 2022 when the dollar was strengthening, the surge ended up subtracting somewhere in the range of 5% to 7% from S&P 500 earnings per share (EPS) results. The biggest multinationals felt the biggest impact. In 2023, with the dollar weakening by approximately 13% from the September highs (as I write), we should see the opposite – a nice boost to earnings in upcoming quarters with weak year-over-year comparisons.
The companies that benefit the least from a weakening dollar tend to be small-caps. These are companies that tend to source inputs from overseas. When the dollar weakens, the costs of overseas production and imports go up, which if not offset by higher prices can adversely impact profit margins. Small-caps also tend to sell their goods and services domestically, meaning they cannot take advantage of favorable conversion rates on foreign income.
From the standpoint of the global economy, the weaker dollar tends to generate more good news than bad. Approximately 60% of global liabilities are denominated in dollars, with much of this being Emerging Markets sovereign debt. As the dollar weakens, the cost of servicing or repaying dollar debt goes down, which provides relief to foreign companies and governments and frees up spending. And, since many goods are priced in dollars from a global trade standpoint, a weaker dollar makes goods more affordable to international buyers. As total trade rises, the global economy grows.
Bottom Line for Investors
Whether the dollar will continue to weaken from here – which would arguably strengthen the positive earnings thesis for large-caps – the answer is unclear. From a monetary policy standpoint, the U.S. appears poised to diverge from other major central banks, and rate differentials are a key driver of currency markets. But on the other hand, history suggests that the end of the rate hike cycle could lead to a few-month period of further weakening, followed by stabilization and strengthening as capital flows back to the U.S.
For investors, the earnings impact is what matters most, in my view. I’ve mentioned in previous columns that Zacks expects earnings rebound to take hold by Q4 of this year. With easier earnings comparisons in the fourth quarter (compared to Q4 2022), stable demand and spending data, and a weaker dollar, I expect large-cap multinationals could experience a nice bump in profits.
Disclosure
2 Fred Economic Data. July 21, 2023. https://fred.stlouisfed.org/series/DTWEXBGS#
3 Fred Economic Data. July 24, 2023. https://fred.stlouisfed.org/series/DTWEXBGS#
DISCLOSURE
Past performance is no guarantee of future results. Inherent in any investment is the potential for loss.
Zacks Investment Management, Inc. is a wholly-owned subsidiary of Zacks Investment Research. Zacks Investment Management is an independent Registered Investment Advisory firm and acts as an investment manager for individuals and institutions. Zacks Investment Research is a provider of earnings data and other financial data to institutions and to individuals.
This material is being provided for informational purposes only and nothing herein constitutes investment, legal, accounting or tax advice, or a recommendation to buy, sell or hold a security. Do not act or rely upon the information and advice given in this publication without seeking the services of competent and professional legal, tax, or accounting counsel. Publication and distribution of this article is not intended to create, and the information contained herein does not constitute, an attorney-client relationship. No recommendation or advice is being given as to whether any investment or strategy is suitable for a particular investor. It should not be assumed that any investments in securities, companies, sectors or markets identified and described were or will be profitable. All information is current as of the date of herein and is subject to change without notice. Any views or opinions expressed may not reflect those of the firm as a whole.
Any projections, targets, or estimates in this report are forward looking statements and are based on the firm’s research, analysis, and assumptions. Due to rapidly changing market conditions and the complexity of investment decisions, supplemental information and other sources may be required to make informed investment decisions based on your individual investment objectives and suitability specifications. All expressions of opinions are subject to change without notice. Clients should seek financial advice regarding the appropriateness of investing in any security or investment strategy discussed in this presentation.
Certain economic and market information contained herein has been obtained from published sources prepared by other parties. Zacks Investment Management does not assume any responsibility for the accuracy or completeness of such information. Further, no third party has assumed responsibility for independently verifying the information contained herein and accordingly no such persons make any representations with respect to the accuracy, completeness or reasonableness of the information provided herein. Unless otherwise indicated, market analysis and conclusions are based upon opinions or assumptions that Zacks Investment Management considers to be reasonable. Any investment inherently involves a high degree of risk, beyond any specific risks discussed herein.
The S&P 500 Index is a well-known, unmanaged index of the prices of 500 large-company common stocks, mainly blue-chip stocks, selected by Standard & Poor’s. The S&P 500 Index assumes reinvestment of dividends but does not reflect advisory fees. The volatility of the benchmark may be materially different from the individual performance obtained by a specific investor. An investor cannot invest directly in an index.
The Russell 1000 Growth Index is a well-known, unmanaged index of the prices of 1000 large-company growth common stocks selected by Russell. The Russell 1000 Growth Index assumes reinvestment of dividends but does not reflect advisory fees. An investor cannot invest directly in an index. The volatility of the benchmark may be materially different from the individual performance obtained by a specific investor.
Nasdaq Composite Index is the market capitalization-weighted index of over 3,300 common equities listed on the Nasdaq stock exchange. The types of securities in the index include American depositary receipts, common stocks, real estate investment trusts (REITs) and tracking stocks, as well as limited partnership interests. The index includes all Nasdaq-listed stocks that are not derivatives, preferred shares, funds, exchange-traded funds (ETFs) or debenture securities. An investor cannot invest directly in an index. The volatility of the benchmark may be materially different from the individual performance obtained by a specific investor.
The Dow Jones Industrial Average measures the daily stock market movements of 30 U.S. publicly-traded companies listed on the NASDAQ or the New York Stock Exchange (NYSE). The 30 publicly-owned companies are considered leaders in the United States economy. An investor cannot directly invest in an index. The volatility of the benchmark may be materially different from the individual performance obtained by a specific investor.
The Bloomberg Global Aggregate Index is a flagship measure of global investment grade debt from twenty-four local currency markets. This multi-currency benchmark includes treasury, government-related, corporate and securitized fixed-rate bonds from both developed and emerging markets issuers. An investor cannot invest directly in an index. The volatility of the benchmark may be materially different from the individual performance obtained by a specific investor.
The ICE Exchange-Listed Fixed & Adjustable Rate Preferred Securities Index is a modified market capitalization weighted index composed of preferred stock and securities that are functionally equivalent to preferred stock including, but not limited to, depositary preferred securities, perpetual subordinated debt and certain securities issued by banks and other financial institutions that are eligible for capital treatment with respect to such instruments akin to that received for issuance of straight preferred stock. An investor cannot invest directly in an index. The volatility of the benchmark may be materially different from the individual performance obtained by a specific investor.
The MSCI ACWI ex U.S. Index captures large and mid-cap representation across 22 of 23 Developed Markets (DM) countries (excluding the United States) and 24 Emerging Markets (EM) countries. The index covers approximately 85% of the global equity opportunity set outside the U.S. An investor cannot invest directly in an index. The volatility of the benchmark may be materially different from the individual performance obtained by a specific investor.
The Russell 2000 Index is a well-known, unmanaged index of the prices of 2000 small-cap company common stocks, selected by Russell. The Russell 2000 Index assumes reinvestment of dividends but does not reflect advisory fees. An investor cannot invest directly in an index. The volatility of the benchmark may be materially different from the individual performance obtained by a specific investor.
The S&P Mid Cap 400 provides investors with a benchmark for mid-sized companies. The index, which is distinct from the large-cap S&P 500, is designed to measure the performance of 400 mid-sized companies, reflecting the distinctive risk and return characteristics of this market segment.
The S&P 500 Pure Value index is a style-concentrated index designed to track the performance of stocks that exhibit the strongest value characteristics by using a style-attractiveness-weighting scheme. An investor cannot directly invest in an index. The volatility of the benchmark may be materially different from the individual performance obtained by a specific investor.