Investors have recently been embracing an asset class that in years past hasn’t received much attention at all: money market funds.
Indeed, flows into money market funds have been soaring over the past several months. By the end of Q1 2023, cash parked in money market funds grew to a record-high $5.7 trillion, following several weeks of positive fund flows. As the chart below shows, the last two occasions when cash in money market funds increased so substantially was before the 2008 Global Financial Crisis and again before the pandemic.1
Total Assets in Money Market Funds
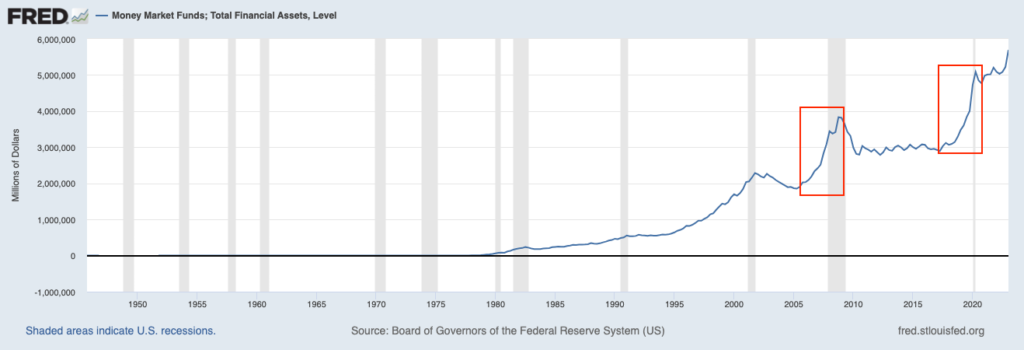
Source: Federal Reserve Bank of St. Louis2
As a quick refresher for readers, money market funds are a type of mutual fund that invests in various liquid instruments, like cash, short-term U.S. Treasuries, cash equivalent securities, and others. For this reason, they are largely considered safe, but they are not risk-free like U.S. Treasuries. And since money market funds are generally managed, they also tend to have expense ratios associated with them – which can cut into returns slightly.
There’s a pretty straightforward reason money market fund flows have jumped substantially over the past several months. It’s because yields have gone up substantially, too. A good proxy for money market yields is the 3-month Treasury bill, which is primarily guided by Federal Reserve monetary policy. 2023 has also been unique for short-duration T-bills because of the debt ceiling standoff, the uncertainty of which drove yields even higher. All told, and as seen in the chart below, 3-month Treasury bills have seen a historic surge in yields, which has also pulled money market fund yields higher.
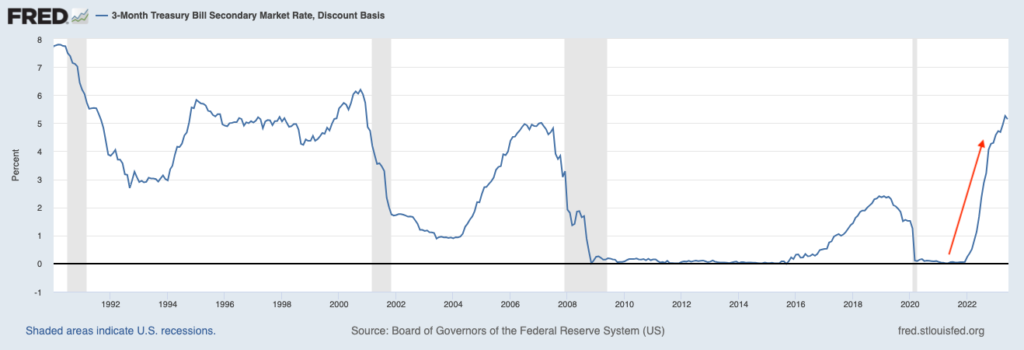
Source: Federal Reserve Bank of St. Louis3
With many money market funds now sporting yields of ~5% or higher, active investors increasingly see ‘cash’ as a viable asset class next to equities, bonds, real estate, etc. And for investors wondering if this could act as a headwind for risk assets in the near term, the answer from a historical perspective is yes.
Two examples come to mind. In the lead-up to the 1987 Black Monday Crash, short-duration T-bills were paying high single-digits, which many historians would argue contributed to a rapid shift out of equities and into fixed income. There was also the 1994 bond market crisis when the Fed quickly and unexpectedly raised interest rates at several meetings, which in turn drove up money market yields and led to a sharp shift away from stocks and bonds and into cash.
What’s notable about these two examples – and the point I want to drive home to readers – is that both events resulted in market corrections, not prolonged bear markets. The real insight of money market fund flows, in my view, isn’t that higher yields may result in stock and bond market volatility. It’s that surging levels of money market funds tell us how much cash is available to flow into risk assets on a forward basis. In my view, more cash on the sidelines equates to more ammo for future returns in risk assets. Money market yields may be attractive now, but they don’t size up to risk-adjusted long-term returns investors have historically earned from stocks.
Some of the historical numbers bear this point out. In the years following the 1987 Black Monday Crash, the S&P 500 rose +16.54% (1988) and +31.48% (1989), and following the 1994 bond market crisis, stocks were up +37.20% (1995), +22.68% (1996), and +33.10% (1997). Money market funds were in those cases a viable alternative to stocks, as they are now, but they did not serve as headwinds for long.
Bottom Line for Investors
Higher yields in money market funds and short-term Treasury bills are largely by design. The Federal Reserve’s goal is to lower inflation, and part of that job entails trying to get investors to move funds away from economically sensitive assets. Recent trends in money market funds suggest the Fed’s actions are having an effect, but forward-looking investors should see the data in another light—more cash on the sidelines means more cash available to invest in risk assets over time.
Disclosure
2 Fred Economic Data. June 8, 2023. https://fred.stlouisfed.org/series/MMMFFAQ027S#
3 Fred Economic Data. June 13, 2023. https://fred.stlouisfed.org/series/DTB3#
DISCLOSURE
Past performance is no guarantee of future results. Inherent in any investment is the potential for loss.
Zacks Investment Management, Inc. is a wholly-owned subsidiary of Zacks Investment Research. Zacks Investment Management is an independent Registered Investment Advisory firm and acts as an investment manager for individuals and institutions. Zacks Investment Research is a provider of earnings data and other financial data to institutions and to individuals.
This material is being provided for informational purposes only and nothing herein constitutes investment, legal, accounting or tax advice, or a recommendation to buy, sell or hold a security. Do not act or rely upon the information and advice given in this publication without seeking the services of competent and professional legal, tax, or accounting counsel. Publication and distribution of this article is not intended to create, and the information contained herein does not constitute, an attorney-client relationship. No recommendation or advice is being given as to whether any investment or strategy is suitable for a particular investor. It should not be assumed that any investments in securities, companies, sectors or markets identified and described were or will be profitable. All information is current as of the date of herein and is subject to change without notice. Any views or opinions expressed may not reflect those of the firm as a whole.
Any projections, targets, or estimates in this report are forward looking statements and are based on the firm’s research, analysis, and assumptions. Due to rapidly changing market conditions and the complexity of investment decisions, supplemental information and other sources may be required to make informed investment decisions based on your individual investment objectives and suitability specifications. All expressions of opinions are subject to change without notice. Clients should seek financial advice regarding the appropriateness of investing in any security or investment strategy discussed in this presentation.
Certain economic and market information contained herein has been obtained from published sources prepared by other parties. Zacks Investment Management does not assume any responsibility for the accuracy or completeness of such information. Further, no third party has assumed responsibility for independently verifying the information contained herein and accordingly no such persons make any representations with respect to the accuracy, completeness or reasonableness of the information provided herein. Unless otherwise indicated, market analysis and conclusions are based upon opinions or assumptions that Zacks Investment Management considers to be reasonable. Any investment inherently involves a high degree of risk, beyond any specific risks discussed herein.
The S&P 500 Index is a well-known, unmanaged index of the prices of 500 large-company common stocks, mainly blue-chip stocks, selected by Standard & Poor’s. The S&P 500 Index assumes reinvestment of dividends but does not reflect advisory fees. The volatility of the benchmark may be materially different from the individual performance obtained by a specific investor. An investor cannot invest directly in an index.